
Concept explainers
Videos
a
To draw
Given information:
Let

The above table shows the percent of U.S households with Television from 2007 through 2012.
Graph:
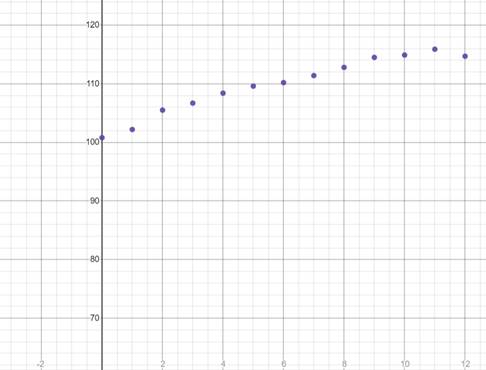
Interpretation:
Using the graphing utility, the scatter plot for the given data is shown above.
b
To find a linear model for the data using regression feature of a graphing utility and coefficient of determination.
Given information:

Calculation:
Using the graphic utility to find the regression,
Insert the data in the table in a graphic utility to get the following results:
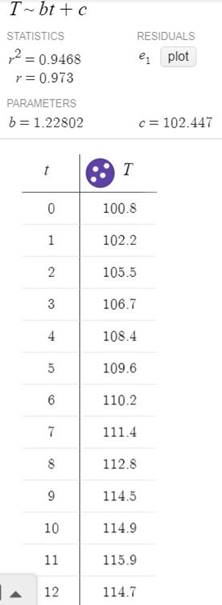
Conclusion:
Therefore, from the above figure., the regression equation for the linear model is
c
To draw the graph with the scatter plot from subpart (a) using a graphic utility.
Given information:
Graph:
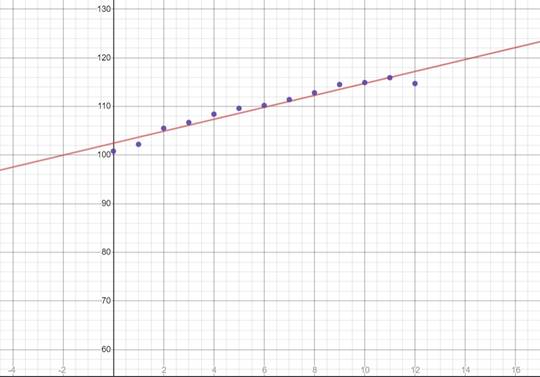
Interpretation:
Using a graphic utility, a straight line is formed when the data is kept on a graph.
d
To find a quadratic model for the data using regression feature of a graphing utility and determine the coefficient of determination.
Given information:

Calculation:
Using the graphic utility to find the regression,
Insert the data in the table in a graphic utility to get the following results:
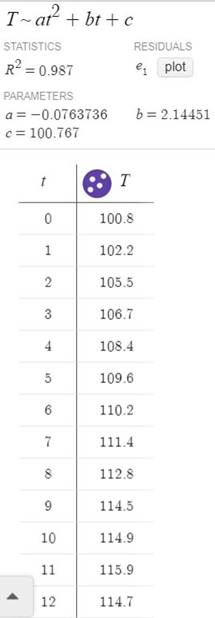
Conclusion:
Therefore, from the above figure., the regression equation for the quadratic model is
e
To draw the graph with the scatter plot from subpart (a) using a graphic utility.
Given information:

Graph:
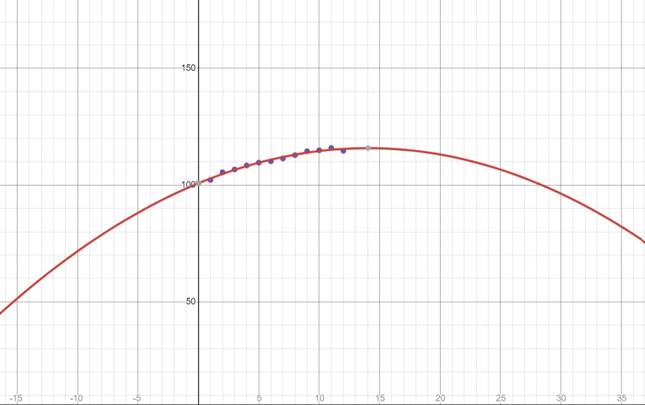
Interpretation:
Using a graphic utility, a parabola is formed when the data is kept on a graph.
f
To find a better fit for the data given.
Quadratic model
Given information:
Coefficient of determination:
Quadratic model:
Linear model:
Explanation:
Coefficient of regression is an indicator of how well the regression model fits the data, with a value nearing 1 indicating a good fit and one near 0 indicating a poor fit.
Here, the coefficient of determination of quadratic model is higher than the linear mode.
Therefore, Quadratic model fits well for the given data.
g
To find the year when the model will reach 120 million.
Yes, it is possible if it is a quadratic model.
Given information:

Explanation:
For linear model,
With the help of the equation
On Substituting
It is observed that the values are negative for different values of
Therefore, this is a not good model for the data.
For quadratic model,
With the help of the equation
On Substituting
On Substituting
It is observed that the number of household with television reaches 120 million in the year 2012.
Therefore, Quadratic model is the best fit for the given data.
Chapter 2 Solutions
Precalculus with Limits: A Graphing Approach


- Evaluate the triple integral 3' 23 HIG 2 +3 f(x, y, z)dxdydz where f(x, y, z) = x + 2x-y ม u = v = and w = 2 2 3 Triple Integral Region R -2 x N 2 y 3arrow_forwardFind the volume of the solid bounded below by the circular cone z = 2.5√√√x² + y² and above by the sphere x² + y²+z² = 6.5z.arrow_forwardElectric charge is distributed over the triangular region D shown below so that the charge density at (x, y) is σ(x, y) = 4xy, measured in coulumbs per square meter (C/m²). Find the total charge on D. Round your answer to four decimal places. 1 U 5 4 3 2 1 1 2 5 7 coulumbsarrow_forward
- Let E be the region bounded cone z = √√/6 - (x² + y²) and the sphere z = x² + y² + z² . Provide an answer accurate to at least 4 significant digits. Find the volume of E. Triple Integral Spherical Coordinates Cutout of sphere is for visual purposes 0.8- 0.6 z 04 0.2- 0- -0.4 -0.2 04 0 0.2 0.2 x -0.2 04 -0.4 Note: The graph is an example. The scale and equation parameters may not be the same for your particular problem. Round your answer to 4 decimal places. Hint: Solve the cone equation for phi. * Oops - try again.arrow_forwardThe temperature at a point (x,y,z) of a solid E bounded by the coordinate planes and the plane 9.x+y+z = 1 is T(x, y, z) = (xy + 8z +20) degrees Celcius. Find the average temperature over the solid. (Answer to 4 decimal places). Average Value of a function using 3 variables z 1- y Hint: y = -a·x+1 * Oops - try again. xarrow_forwardFind the saddle pointsarrow_forward
- For the curve defined by r(t) = (e** cos(t), et sin(t)) find the unit tangent vector, unit normal vector, normal acceleration, and tangential acceleration at t = πT 3 T (1) N Ň (1) 133 | aN = 53 ar = = =arrow_forwardFind the tangential and normal components of the acceleration vector for the curve - F(t) = (2t, −3t³, −3+¹) at the point t = 1 - ā(1) = T + Ñ Give your answers to two decimal placesarrow_forwardFind the unit tangent vector to the curve defined by (t)=(-2t,-4t, √√49 - t²) at t = −6. T(−6) =arrow_forward
- An airplane flies due west at an airspeed of 428 mph. The wind blows in the direction of 41° south of west at 50 mph. What is the ground speed of the airplane? What is the bearing of the airplane? 428 mph 41° 50 mph a. The ground speed of the airplane is b. The bearing of the airplane is mph. south of west.arrow_forwardRylee's car is stuck in the mud. Roman and Shanice come along in a truck to help pull her out. They attach one end of a tow strap to the front of the car and the other end to the truck's trailer hitch, and the truck starts to pull. Meanwhile, Roman and Shanice get behind the car and push. The truck generates a horizontal force of 377 lb on the car. Roman and Shanice are pushing at a slight upward angle and generate a force of 119 lb on the car. These forces can be represented by vectors, as shown in the figure below. The angle between these vectors is 20.2°. Find the resultant force (the vector sum), then give its magnitude and its direction angle from the positive x-axis. 119 lb 20.2° 377 lb a. The resultant force is (Tip: omit degree notations from your answers; e.g. enter cos(45) instead of cos(45°)) b. It's magnitude is lb. c. It's angle from the positive x-axis isarrow_forwardFind a plane containing the point (3, -3, 1) and the line of intersection of the planes 2x + 3y - 3z = 14 and -3x - y + z = −21. The equation of the plane is:arrow_forward
 Calculus: Early TranscendentalsCalculusISBN:9781285741550Author:James StewartPublisher:Cengage Learning
 Thomas' Calculus (14th Edition)CalculusISBN:9780134438986Author:Joel R. Hass, Christopher E. Heil, Maurice D. WeirPublisher:PEARSON
 Calculus: Early Transcendentals (3rd Edition)CalculusISBN:9780134763644Author:William L. Briggs, Lyle Cochran, Bernard Gillett, Eric SchulzPublisher:PEARSON
 Calculus: Early TranscendentalsCalculusISBN:9781319050740Author:Jon Rogawski, Colin Adams, Robert FranzosaPublisher:W. H. Freeman
 Calculus: Early Transcendental FunctionsCalculusISBN:9781337552516Author:Ron Larson, Bruce H. EdwardsPublisher:Cengage Learning