
Concept explainers
Videos
a
To draw
a
Explanation of Solution
Given information:
Let

The above table shows sales
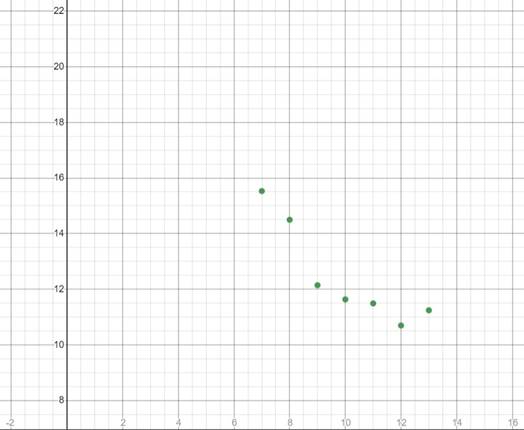
Graph:
Interpretation:
Using the graphing utility, the scatter plot for the given data is shown above.
b
To find a quadratic model for the data using regression feature of a graphing utility.
b
Explanation of Solution
Given information:

Calculation:
Using the graphic utility to find the regression,
Insert the data in the table in a grpahic utility to get the following results:
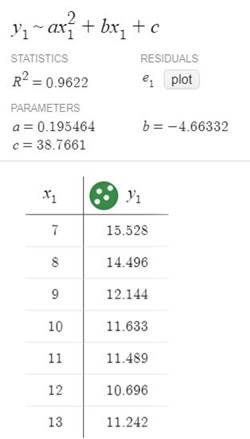
Conclusion:
Therefore, from the above figure., the regression equation for the quadratic model is
c
To draw the graph with the scatter plot from subpart (a) using a graphic utility.
c
Explanation of Solution
Given information:
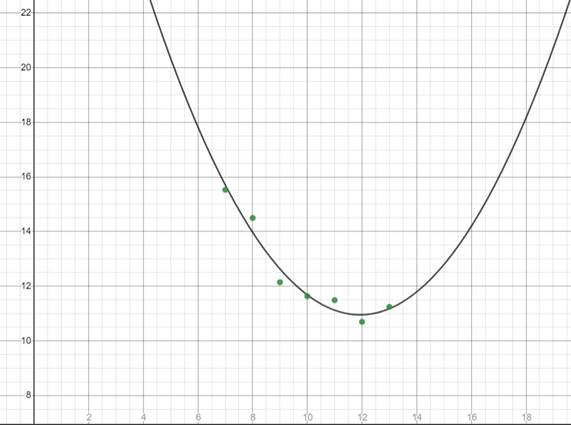
Graph:
Interpretation:
Using a graphic utility, a parabola is formed when the data is kept on a graph.
d
To find the first year when the office Depot will have sales greater than $14 billion using the model.
d
Answer to Problem 160RE
Explanation of Solution
Given information:

Substitute for the various values of
Conclusion:
Therefore,2007 is the first year when Office Depot will have sales greater than $14 billion.
e
To find if this is the best model for predicting the sakes of Office Depots in future years.
e
Answer to Problem 160RE
Yes
Explanation of Solution
Given information:

When comparing the sales in the table and in subpart (d), the values are almost same in each year. Therefore, this is a good model for predicting the sales of Office Depot in future years.
Conclusion:
Therefore, this is a good model for predicting the sales of Office Depot in future years.
Chapter 2 Solutions
Precalculus with Limits: A Graphing Approach


- Consider the function f(x) = x²-1. (a) Find the instantaneous rate of change of f(x) at x=1 using the definition of the derivative. Show all your steps clearly. (b) Sketch the graph of f(x) around x = 1. Draw the secant line passing through the points on the graph where x 1 and x-> 1+h (for a small positive value of h, illustrate conceptually). Then, draw the tangent line to the graph at x=1. Explain how the slope of the tangent line relates to the value you found in part (a). (c) In a few sentences, explain what the instantaneous rate of change of f(x) at x = 1 represents in the context of the graph of f(x). How does the rate of change of this function vary at different points?arrow_forward1. The graph of ƒ is given. Use the graph to evaluate each of the following values. If a value does not exist, state that fact. и (a) f'(-5) (b) f'(-3) (c) f'(0) (d) f'(5) 2. Find an equation of the tangent line to the graph of y = g(x) at x = 5 if g(5) = −3 and g'(5) = 4. - 3. If an equation of the tangent line to the graph of y = f(x) at the point where x 2 is y = 4x — 5, find ƒ(2) and f'(2).arrow_forwardDoes the series converge or divergearrow_forward
- Suppose that a particle moves along a straight line with velocity v (t) = 62t, where 0 < t <3 (v(t) in meters per second, t in seconds). Find the displacement d (t) at time t and the displacement up to t = 3. d(t) ds = ["v (s) da = { The displacement up to t = 3 is d(3)- meters.arrow_forwardLet f (x) = x², a 3, and b = = 4. Answer exactly. a. Find the average value fave of f between a and b. fave b. Find a point c where f (c) = fave. Enter only one of the possible values for c. c=arrow_forwardplease do Q3arrow_forward
- Use the properties of logarithms, given that In(2) = 0.6931 and In(3) = 1.0986, to approximate the logarithm. Use a calculator to confirm your approximations. (Round your answers to four decimal places.) (a) In(0.75) (b) In(24) (c) In(18) 1 (d) In ≈ 2 72arrow_forwardFind the indefinite integral. (Remember the constant of integration.) √tan(8x) tan(8x) sec²(8x) dxarrow_forwardFind the indefinite integral by making a change of variables. (Remember the constant of integration.) √(x+4) 4)√6-x dxarrow_forward
 Calculus: Early TranscendentalsCalculusISBN:9781285741550Author:James StewartPublisher:Cengage Learning
 Thomas' Calculus (14th Edition)CalculusISBN:9780134438986Author:Joel R. Hass, Christopher E. Heil, Maurice D. WeirPublisher:PEARSON
 Calculus: Early Transcendentals (3rd Edition)CalculusISBN:9780134763644Author:William L. Briggs, Lyle Cochran, Bernard Gillett, Eric SchulzPublisher:PEARSON
 Calculus: Early TranscendentalsCalculusISBN:9781319050740Author:Jon Rogawski, Colin Adams, Robert FranzosaPublisher:W. H. Freeman
 Calculus: Early Transcendental FunctionsCalculusISBN:9781337552516Author:Ron Larson, Bruce H. EdwardsPublisher:Cengage Learning