
Concept explainers
Videos
a
To draw
a
Explanation of Solution
Given information:
Let
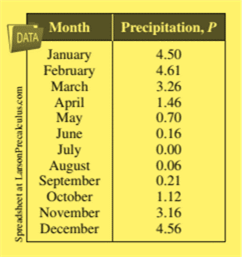
The above table shows the normal monthly precipitation (Inches) for San Francisco, California.
Graph:
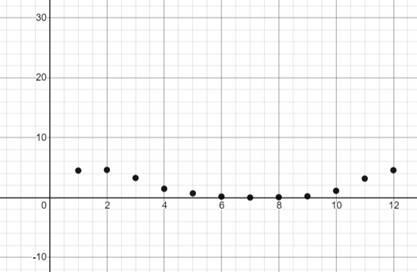
Interpretation:
Using the graphing utility, the scatter plot for the given data is shown above.
b
To find a quadratic model for the data using regression feature of a graphing utility and to identify the coefficient of determination.
b
Explanation of Solution
Given information:

Calculation:
Using the graphic utility to find the regression,
Insert the data in the table in a grpahic utility to get the following results:
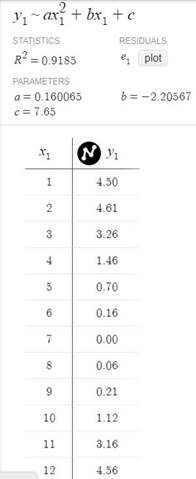
Conclusion:
Therefore, from the above figure, the regression equation for the quadratic model is
c
To draw the graph with the scatter plot from subpart (a) using a graphic utility.
c
Explanation of Solution
Given information:

Graph:
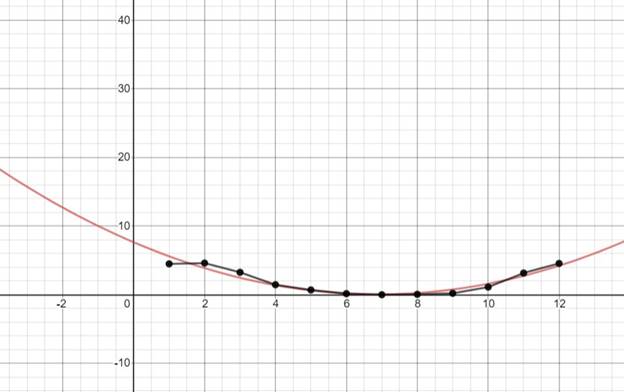
Interpretation:
Using a graphic utility, a parabola is formed when the data is kept on a graph.
d
To observe the graph in subpart (c) and find the month with the least precipitation in San Franciso, California.
d
Answer to Problem 17E
July
Explanation of Solution
Given information:
Refer to the graph in subpart (c).
On observing the graph in subpart (c), it is clear the that the least precipitation has occurred at the point
e
To observe the given table and find the month with the least precipitation in San Franciso, California and compare to that of the option in subpart (d).
e
Answer to Problem 17E
July
Explanation of Solution
Given information:

On observing the table, we find that the precipitation in the month of July is the least with 0.00 inches.
Conclusion:
Also, it is obvious from the graph and the table that least precipitation has occurred in the month of July.
Chapter 2 Solutions
Precalculus with Limits: A Graphing Approach


- For the system consisting of the lines: and 71 = (-8,5,6) + t(4, −5,3) 72 = (0, −24,9) + u(−1, 6, −3) a) State whether the two lines are parallel or not and justify your answer. b) Find the point of intersection, if possible, and classify the system based on the number of points of intersection and how the lines are related. Show a complete solution process.arrow_forward3. [-/2 Points] DETAILS MY NOTES SESSCALCET2 7.4.013. Find the exact length of the curve. y = In(sec x), 0 ≤ x ≤ π/4arrow_forwardH.w WI M Wz A Sindax Sind dy max Утах at 0.75m from A w=6KN/M L=2 W2=9 KN/m P= 10 KN B Make the solution handwritten and not artificial intelligence because I will give a bad rating if you solve it with artificial intelligencearrow_forward
- Solve by DrWz WI P L B dy Sind Ⓡ de max ⑦Ymax dx Solve by Dr ③Yat 0.75m from A w=6KN/M L=2 W2=9 kN/m P= 10 KN Solve By Drarrow_forwardHow to find the radius of convergence for the series in the image below? I'm stuck on how to isolate the x in the interval of convergence.arrow_forwardDetermine the exact signed area between the curve g(x): x-axis on the interval [0,1]. = tan2/5 secx dx andarrow_forward
 Calculus: Early TranscendentalsCalculusISBN:9781285741550Author:James StewartPublisher:Cengage Learning
 Thomas' Calculus (14th Edition)CalculusISBN:9780134438986Author:Joel R. Hass, Christopher E. Heil, Maurice D. WeirPublisher:PEARSON
 Calculus: Early Transcendentals (3rd Edition)CalculusISBN:9780134763644Author:William L. Briggs, Lyle Cochran, Bernard Gillett, Eric SchulzPublisher:PEARSON
 Calculus: Early TranscendentalsCalculusISBN:9781319050740Author:Jon Rogawski, Colin Adams, Robert FranzosaPublisher:W. H. Freeman
 Calculus: Early Transcendental FunctionsCalculusISBN:9781337552516Author:Ron Larson, Bruce H. EdwardsPublisher:Cengage Learning