
Concept explainers
Videos
a
To draw
a
Explanation of Solution
Given information:
Let
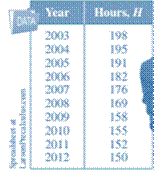
The above table shows the average number of hours H that adults spend in reading newspaper each year from 2003 through 2012.
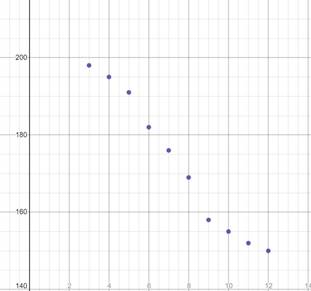
Graph:
Interpretation:
Using the graphing utility, the scatter plot for the given data is shown above.
b
To graph the given cubic model using graphing utility.
b
Explanation of Solution
Given information:
Cubic model
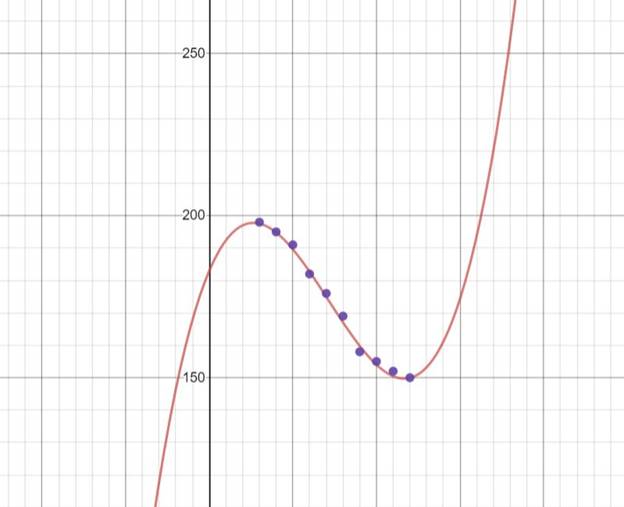
Graph:
Interpretation:
Using the graphing utility, the scatter plot for the given data is shown above.
From the graph, it is observed that the cubic model best fits the data. Since the curve passes through all the points of the scatter plot in subpart (a).
Conclusion:
Cubic model best fits the data.
c
To find a quadratic model for the data using regression feature of a graphing utility and coefficient of determination.
c
Explanation of Solution
Given information:

Calculation:
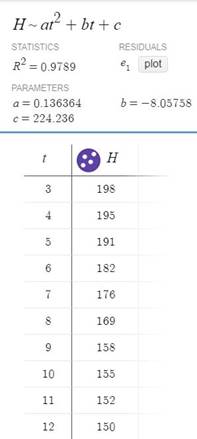
Using the graphing utility to find the regression,
Insert the data in the table in a graphing utility to get the following results:
Conclusion:
Therefore, from the above figure, the regression equation for the quadratic model is
d
To draw the graph for quadratic model with the scatter plot from subpart (a) using a graphing utility and find if the quadratic model a good fit for the data.
d
Explanation of Solution
Given information:
Refer to the scatter plot in subpart (a).
Graph:
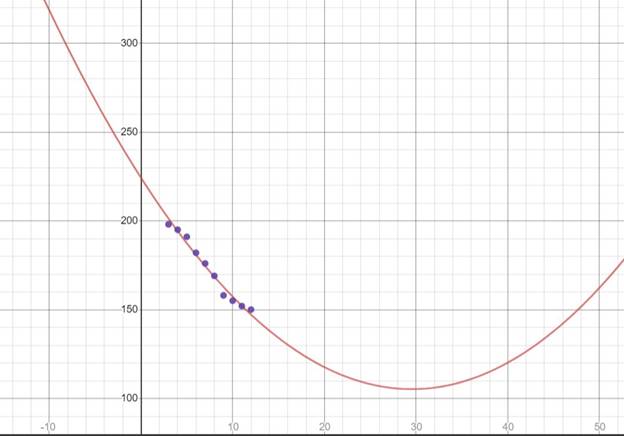
Interpretation:
Using a graphing utility, a parabola is formed when the data is kept on a graph.
Quadratic model is not a good fit because the curve of the parabola does not pass through all the points of the scatter plot.
e
To find the model that fits best for the data provided.
e
Answer to Problem 20E
Cubic model
Explanation of Solution
Given information:
From the subparts (b) and (c),
Coefficients of determination of:
Quadratic model:
Cubic model:
The coefficient of determination is used to find how well a regression model (a statistical tool that determines the relationship between dependent variable and one or more independent variables) fits into the data within the values 0 and 1.
In simple words, it determines the goodness of fit.
A coefficient of determination whose value is near 1 indicates a good fit while the coefficient of determination whose value is near 0 indicates a poor fit.
Here, coefficient of determination of quadratic model
Conclusion:
Therefore, The coefficient of regression of cubic model,
f
To predict the average number of hours that adult spend on reading newspaper using the cubic and quadratic models in subparts (b) and (c) and explain the reason for the difference in values of the table from that of the new one.
f
Explanation of Solution
Given information:
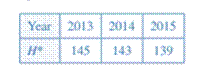
The table shows the average number of hours H that adults spend in reading newspaper each year from 2013 through 2015.
Consider the cubic model,
Substitute for the values of
| Year | ||
| 2013 | 13 | 153.217 |
| 2014 | 14 | 161.104 |
| 2015 | 15 | 174.375 |
Consider the quadratic model,
Substitute for the values of
| Year | ||
| 2013 | 13 | 142.533 |
| 2014 | 14 | 138.1572 |
| 2015 | 15 | 134.0542 |
The values in the table differs with that of the values found with the equation of both the models because the cubic model is the best fit for the data.
It provides a better data.
Chapter 2 Solutions
Precalculus with Limits: A Graphing Approach


- A graph of the function f is given below: Study the graph of ƒ at the value given below. Select each of the following that applies for the value a = 1 Of is defined at a. If is not defined at x = a. Of is continuous at x = a. If is discontinuous at x = a. Of is smooth at x = a. Of is not smooth at = a. If has a horizontal tangent line at = a. f has a vertical tangent line at x = a. Of has a oblique/slanted tangent line at x = a. If has no tangent line at x = a. f(a + h) - f(a) lim is finite. h→0 h f(a + h) - f(a) lim h->0+ and lim h h->0- f(a + h) - f(a) h are infinite. lim does not exist. h→0 f(a+h) - f(a) h f'(a) is defined. f'(a) is undefined. If is differentiable at x = a. If is not differentiable at x = a.arrow_forwardThe graph below is the function f(z) 4 3 -2 -1 -1 1 2 3 -3 Consider the function f whose graph is given above. (A) Find the following. If a function value is undefined, enter "undefined". If a limit does not exist, enter "DNE". If a limit can be represented by -∞o or ∞o, then do so. lim f(z) +3 lim f(z) 1-1 lim f(z) f(1) = 2 = -4 = undefined lim f(z) 1 2-1 lim f(z): 2-1+ lim f(x) 2+1 -00 = -2 = DNE f(-1) = -2 lim f(z) = -2 1-4 lim f(z) 2-4° 00 f'(0) f'(2) = = (B) List the value(s) of x for which f(x) is discontinuous. Then list the value(s) of x for which f(x) is left- continuous or right-continuous. Enter your answer as a comma-separated list, if needed (eg. -2, 3, 5). If there are none, enter "none". Discontinuous at z = Left-continuous at x = Invalid use of a comma.syntax incomplete. Right-continuous at z = Invalid use of a comma.syntax incomplete. (C) List the value(s) of x for which f(x) is non-differentiable. Enter your answer as a comma-separated list, if needed (eg. -2, 3, 5).…arrow_forwardA graph of the function f is given below: Study the graph of f at the value given below. Select each of the following that applies for the value a = -4. f is defined at = a. f is not defined at 2 = a. If is continuous at x = a. Of is discontinuous at x = a. Of is smooth at x = a. f is not smooth at x = a. If has a horizontal tangent line at x = a. f has a vertical tangent line at x = a. Of has a oblique/slanted tangent line at x = a. Of has no tangent line at x = a. f(a + h) − f(a) h lim is finite. h→0 f(a + h) - f(a) lim is infinite. h→0 h f(a + h) - f(a) lim does not exist. h→0 h f'(a) is defined. f'(a) is undefined. If is differentiable at x = a. If is not differentiable at x = a.arrow_forward
- Find the point of diminishing returns (x,y) for the function R(X), where R(x) represents revenue (in thousands of dollars) and x represents the amount spent on advertising (in thousands of dollars). R(x) = 10,000-x3 + 42x² + 700x, 0≤x≤20arrow_forwardDifferentiate the following functions. (a) y(x) = x³+6x² -3x+1 (b) f(x)=5x-3x (c) h(x) = sin(2x2)arrow_forwardx-4 For the function f(x): find f'(x), the third derivative of f, and f(4) (x), the fourth derivative of f. x+7arrow_forward
- In x For the function f(x) = find f'(x). Then find f''(0) and f''(9). 11x'arrow_forwardLet f(x) = √√x+3 and g(x) = 6x − 2. Find each of the following composite functions and state the domain: (a) fog (b) gof, (c) fof (d) gogarrow_forwardCompute the following: (a) 8x³ + 3x dx (b) cos(2u) du (c) f² ebx dxarrow_forward
- Find the following limits. (a) lim 3(x-1)² x→2 x (b) lim 0+x (c) lim 3x2-x+1 x²+3 x²+x-12 x-3 x-3arrow_forwardFor f(x) = (x+3)² - 2 sketch f(x), f(x), f(x − 2), and f(x) — 2. State the coordi- nates of the turning point in each graph.arrow_forwardFor f(x) = (x+3)² - 2 sketch f(x), f(x), f(x − 2), and f(x) — 2. State the coordi- nates of the turning point in each graph.arrow_forward
 Calculus: Early TranscendentalsCalculusISBN:9781285741550Author:James StewartPublisher:Cengage Learning
 Thomas' Calculus (14th Edition)CalculusISBN:9780134438986Author:Joel R. Hass, Christopher E. Heil, Maurice D. WeirPublisher:PEARSON
 Calculus: Early Transcendentals (3rd Edition)CalculusISBN:9780134763644Author:William L. Briggs, Lyle Cochran, Bernard Gillett, Eric SchulzPublisher:PEARSON
 Calculus: Early TranscendentalsCalculusISBN:9781319050740Author:Jon Rogawski, Colin Adams, Robert FranzosaPublisher:W. H. Freeman
 Calculus: Early Transcendental FunctionsCalculusISBN:9781337552516Author:Ron Larson, Bruce H. EdwardsPublisher:Cengage Learning