
Concept explainers
Videos
a.
To use a graphing utility to plot the data and graph the model for
a.
Answer to Problem 113E
The model very closely represents the data.
Explanation of Solution
Given: The U.S. production of crude oil
| Year , t | ||
| 4 | 11.6 | 63 |
| 5 | 11.0 | 63 |
| 6 | 10.8 | 68 |
| 7 | 10.7 | 76 |
| 8 | 10.6 | 89 |
| 9 | 11.3 | 98 |
| 10 | 11.6 | 126 |
| 11 | 12.0 | 171 |
| 12 | 13.8 | 234 |
| 13 | 15.7 | 321 |
Concept Used:
Model of the data is ,
Calculation: For the model for
| Year , t | |
| 4 | 11.6 |
| 5 | 11.0 |
| 6 | 10.8 |
| 7 | 10.7 |
| 8 | 10.6 |
| 9 | 11.3 |
| 10 | 11.6 |
| 11 | 12.0 |
| 12 | 13.8 |
| 13 | 15.7 |
Using a graphing utility graph of the above table is shown below.
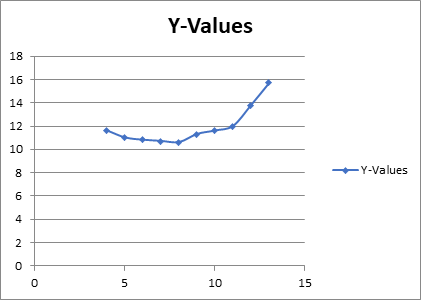
Where t year as x -axis and the corresponding crude oil
Conclusion:
For the graph it is clear that the model very closely represents the data.
b.
To find would use the model to estimate the production of crude oil in 2015, 2020, explain.
b.
Answer to Problem 113E
So, above models can be used to estimate the production of crude oil in 2015, 2020, by substitute t =15 in the above model equation to find the value of
Explanation of Solution
Given:
Given: An open box with locking tabs is to be made from a square piece of material 24 inches on a side. This is done by cutting equal squares from the corners and folding along the dashed lines. The U.S. production of crude oil
| Year , t | ||
| 4 | 11.6 | 63 |
| 5 | 11.0 | 63 |
| 6 | 10.8 | 68 |
| 7 | 10.7 | 76 |
| 8 | 10.6 | 89 |
| 9 | 11.3 | 98 |
| 10 | 11.6 | 126 |
| 11 | 12.0 | 171 |
| 12 | 13.8 | 234 |
| 13 | 15.7 | 321 |
Concept Used:
Model of the data is ,
Calculation:
To estimate the production of crude oil in 2015, 2020,
Substitute t =15 in the above model equation to find the value of
Substitute t =20 in the above model equation to find the value of
Conclusion:
So, above models can be used to estimate the production of crude oil in 2015, 2020, by substitute t =15 in the above model equation to find the value of
c.
To use a graphing utility to plot the data and graph the model for
c.
Answer to Problem 113E
The model very closely represents the data.
The models can be used to estimate the production of crude oil in 2015, 2020, by substitute t =15 in model equation to find the value of
Explanation of Solution
Given:
Given: The U.S. production of crude oil
| Year , t | ||
| 4 | 11.6 | 63 |
| 5 | 11.0 | 63 |
| 6 | 10.8 | 68 |
| 7 | 10.7 | 76 |
| 8 | 10.6 | 89 |
| 9 | 11.3 | 98 |
| 10 | 11.6 | 126 |
| 11 | 12.0 | 171 |
| 12 | 13.8 | 234 |
| 13 | 15.7 | 321 |
Concept Used:
Model of the data is ,
Calculation: For the model for
| Year , t | |
| 4 | 63 |
| 5 | 63 |
| 6 | 68 |
| 7 | 76 |
| 8 | 89 |
| 9 | 98 |
| 10 | 126 |
| 11 | 171 |
| 12 | 234 |
| 13 | 321 |
The graph on above table data is shown below.
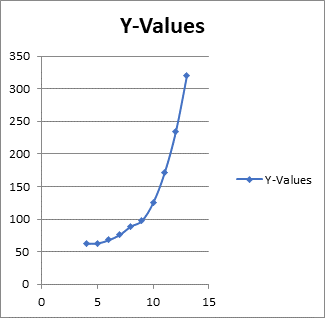
Where t year as x -axis and the corresponding solar and photovoltaic energy
Conclusion:
For the graph it is clear that the model very closely represents the data.
So, above models can be used to estimate the production of crude oil in 2015, 2020, by substitute t =15 in the above model equation to find the value of
Chapter 2 Solutions
Precalculus with Limits: A Graphing Approach


- What is the particular solution to the differential equation y′′ + y = 1/cos t ?arrow_forwardWhich of the following is the general solution to y′′ + 4y = e^2t + 12 sin(2t) ?A. y(t) = c1 cos(2t) + c2 sin(2t) + 1/8 e^2t − 3t cos(2t)B. y(t) = c1e^2t + c2e^−2t + 1/4 te^2t − 3t cos(2t)C. y(t) = c1 + c2e^−4t + 1/12 te^2t − 3t cos(2t)D. y(t) = c1 cos(2t) + c2 sin(2t) + 1/8 e^2t + 3 sin(2t)E. None of the above. Please include all steps! Thank you!arrow_forwardShow that i cote +1 = cosec 20 tan 20+1 = sec² O २ cos² + sin 20 = 1 using pythagon's theoremarrow_forward
- Find the general solution to the differential equationarrow_forwardcharity savings Budget for May travel food Peter earned $700 during May. The graph shows how the money was used. What fraction was clothes? O Search Submit clothes leisurearrow_forwardExercise 11.3 A slope field is given for the equation y' = 4y+4. (a) Sketch the particular solution that corresponds to y(0) = −2 (b) Find the constant solution (c) For what initial conditions y(0) is the solution increasing? (d) For what initial conditions y(0) is the solution decreasing? (e) Verify these results using only the differential equation y' = 4y+4.arrow_forward
- Aphids are discovered in a pear orchard. The Department of Agriculture has determined that the population of aphids t hours after the orchard has been sprayed is approximated by N(t)=1800−3tln(0.17t)+t where 0<t≤1000. Step 1 of 2: Find N(63). Round to the nearest whole number.arrow_forward3. [-/3 Points] DETAILS MY NOTES SCALCET8 7.4.032. ASK YOUR TEACHER PRACTICE ANOTHER Evaluate the integral. X + 4x + 13 Need Help? Read It SUBMIT ANSWER dxarrow_forwardEvaluate the limit, and show your answer to 4 decimals if necessary. Iz² - y²z lim (x,y,z)>(9,6,4) xyz 1 -arrow_forward
 Calculus: Early TranscendentalsCalculusISBN:9781285741550Author:James StewartPublisher:Cengage Learning
 Thomas' Calculus (14th Edition)CalculusISBN:9780134438986Author:Joel R. Hass, Christopher E. Heil, Maurice D. WeirPublisher:PEARSON
 Calculus: Early Transcendentals (3rd Edition)CalculusISBN:9780134763644Author:William L. Briggs, Lyle Cochran, Bernard Gillett, Eric SchulzPublisher:PEARSON
 Calculus: Early TranscendentalsCalculusISBN:9781319050740Author:Jon Rogawski, Colin Adams, Robert FranzosaPublisher:W. H. Freeman
 Calculus: Early Transcendental FunctionsCalculusISBN:9781337552516Author:Ron Larson, Bruce H. EdwardsPublisher:Cengage Learning