Concept explainers
(a)
Interpretation: To indicate whether hexokinase is associated with carbohydrate digestion or the glycolysis
Concept introduction: Carbohydrates are the
Carbohydrates are classified as monosaccharide, disaccharide, oligosaccharide, and polysaccharide. Monosaccharides are the simplest carbohydrate units that cannot be hydrolyzed further to give the smallest units. Disaccharides contain two monosaccharide units. Oligosaccharides contain 3 to 10 monosaccharide units. Polysaccharides contain many carbohydrate units that vary from 100 to 50,000 monosaccharide units.
In the glycolysis metabolic pathway, a glucose molecule breaks down and is converted into two pyruvate molecules along with the production of two ATP molecules and NADH coenzymes.
The block diagram to represent an overview of glycolysis is as follows:
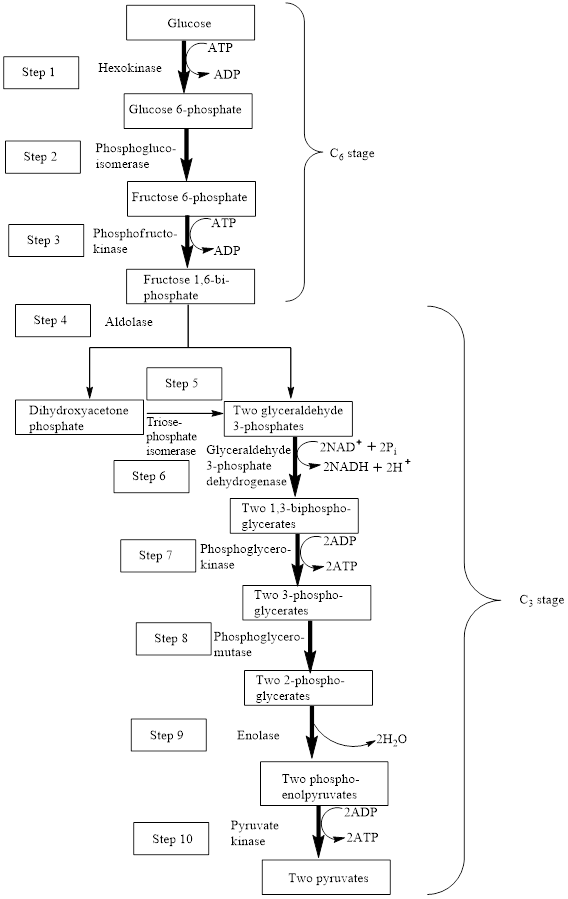
From the above diagram, it is concluded that in the overall process of glycolysis, two stages are present.
a) Steps 1 to 3 represents a six-carbon stage
b) Steps 4 to 10 represent a three-carbon stage
(b)
Interpretation: To indicate whether lactase is associated with carbohydrate digestion or the glycolysis metabolic pathway.
Concept introduction: Carbohydrates are the biomolecules composed of carbon, oxygen and hydrogen atoms. Carbohydrate molecules are joined together by glycosidic linkage.
Carbohydrates are classified as monosaccharide, disaccharide, oligosaccharide, and polysaccharide. Monosaccharides are the simplest carbohydrate units that cannot be hydrolyzed further to give the smallest units. Disaccharides contain two monosaccharide units. Oligosaccharides contain 3 to 10 monosaccharide units. Polysaccharides contain many carbohydrate units that vary from 100 to 50,000 monosaccharide units.
In the glycolysis metabolic pathway, a glucose molecule breaks down and is converted into two pyruvate molecules along with the production of two ATP molecules and NADH coenzymes.
The block diagram to represent an overview of glycolysis is as follows:
From the above diagram, it is concluded that in the overall process of glycolysis, two stages are present.
a) Steps 1 to 3 represents a six-carbon stage
b) Steps 4 to 10 represent a three-carbon stage
(c)
Interpretation: To indicate whether the hydrolysis reaction is associated with carbohydrate digestion or the glycolysis metabolic pathway.
Concept introduction: Carbohydrates are the biomolecules composed of carbon, oxygen and hydrogen atoms. Carbohydrate molecules are joined together by glycosidic linkage.
Carbohydrates are classified as monosaccharide, disaccharide, oligosaccharide, and polysaccharide. Monosaccharides are the simplest carbohydrate units that cannot be hydrolyzed further to give the smallest units. Disaccharides contain two monosaccharide units. Oligosaccharides contain 3 to 10 monosaccharide units. Polysaccharides contain many carbohydrate units that vary from 100 to 50,000 monosaccharide units.
In the glycolysis metabolic pathway, a glucose molecule breaks down and is converted into two pyruvate molecules along with the production of two ATP molecules and NADH coenzymes.
The block diagram to represent an overview of glycolysis is as follows:
From the above diagram, it is concluded that in the overall process of glycolysis, two stages are present.
a) Steps 1 to 3 represents a six-carbon stage
b) Steps 4 to 10 represent a three-carbon stage
(d)
Interpretation: To indicate whether the dehydration reaction is associated with carbohydrate digestion or the glycolysis metabolic pathway.
Concept introduction: Carbohydrates are the biomolecules composed of carbon, oxygen and hydrogen atoms. Carbohydrate molecules are joined together by glycosidic linkage.
Carbohydrates are classified as monosaccharide, disaccharide, oligosaccharide, and polysaccharide. Monosaccharides are the simplest carbohydrate units that cannot be hydrolyzed further to give the smallest units. Disaccharides contain two monosaccharide units. Oligosaccharides contain 3 to 10 monosaccharide units. Polysaccharides contain many carbohydrate units that vary from 100 to 50,000 monosaccharide units.
In the glycolysis metabolic pathway, a glucose molecule breaks down and is converted into two pyruvate molecules along with the production of two ATP molecules and NADH coenzymes.
The block diagram to represent an overview of glycolysis is as follows:
From the above diagram, it is concluded that in the overall process of glycolysis, two stages are present.
a) Steps 1 to 3 represents a six-carbon stage
b) Steps 4 to 10 represent a three-carbon stage
Want to see the full answer?
Check out a sample textbook solution
Chapter 24 Solutions
General, Organic, and Biological Chemistry


- If the energy absorbed per mole of gas is 480 kJ mol-1, indicate the number of Einsteins per mole.Data: Energy of each photon: 0.7835x10⁻¹⁸ J.arrow_forwardIf the energy absorbed per mole of gas is 480 kJ mol-1, indicate the number of Einsteins per mole.arrow_forwardThe quantum yield of the photochemical decay of HI is 2. Calculating the moles of HI per kJ of radiant energy can be decayed knowing that the energy absorbed per mole of photons is 490 kJ.arrow_forward
- The quantum yield of the photochemical decay of HI is 2. Calculate the number of Einsteins absorbed per mole knowing that the energy absorbed per mole of photons is 490 kJ.arrow_forwardThe quantum yield of the photochemical decay of HI is 2. How many moles of HI per kJ of radiant energy can be decayed knowing that the energy absorbed per mole of photons is 490 kJ.arrow_forwardIf the energy absorbed per mole of photons is 450 kJ, the number of Einsteins absorbed per 1 mole.arrow_forward
- When propionic aldehyde in vapor form at 200 mmHg and 30°C is irradiated with radiation of wavelength 302 nm, the quantum yield with respect to the formation of CO is 0.54. If the intensity of the incident radiation is 1.5x10⁻³ W, find the rate of formation of CO.arrow_forwardDraw mechanismarrow_forwardDoes Avogadro's number have units?arrow_forward
- Explain why the total E in an Einstein depends on the frequency or wavelength of the light.arrow_forwardIf the dissociation energy of one mole of O2 is 5.17 eV, determine the wavelength that must be used to dissociate it with electromagnetic radiation. Indicate how many Einstein's of this radiation are needed to dissociate 1 liter of O2 at 25°C and 1 atm of pressure.Data: 1 eV = 96485 kJ mol-1; R = 0.082 atm L K-1; c = 2.998x10⁸ m s-1; h = 6.626x10⁻³⁴ J s; NA = 6.022x 10²³ mol-1arrow_forwardIndicate the number of Einsteins that are equivalent to 550 kJ mol⁻¹ of absorbed energy (wavelength 475 nm).arrow_forward
 Chemistry for Today: General, Organic, and Bioche...ChemistryISBN:9781305960060Author:Spencer L. Seager, Michael R. Slabaugh, Maren S. HansenPublisher:Cengage Learning
 Introduction to General, Organic and BiochemistryChemistryISBN:9781285869759Author:Frederick A. Bettelheim, William H. Brown, Mary K. Campbell, Shawn O. Farrell, Omar TorresPublisher:Cengage Learning
 General, Organic, and Biological ChemistryChemistryISBN:9781285853918Author:H. Stephen StokerPublisher:Cengage Learning
 Organic And Biological ChemistryChemistryISBN:9781305081079Author:STOKER, H. Stephen (howard Stephen)Publisher:Cengage Learning,