Concept explainers
Videos
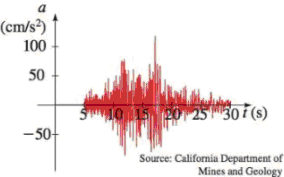
Earthquake The graph shows the vertical acceleration of the ground from the 1994 Northridge earthquake in Los Angeles, as measured by a seismograph. (Here t represents the time in seconds.)
- (a) At what time t did the earthquake first make noticeable movements of the earth?
- (b) At what time t did the earthquake seem to end?
- (c) At what time t was the maximum intensity of the earthquake reached?
(a)
The time at which the earthquake first make the noticeable movements of the earth.
Answer to Problem 44E
The first noticeable movement took place after 5 seconds.
Explanation of Solution
A graph is given which shows the vertical acceleration of the ground from an earthquake as measured by a seismograph.
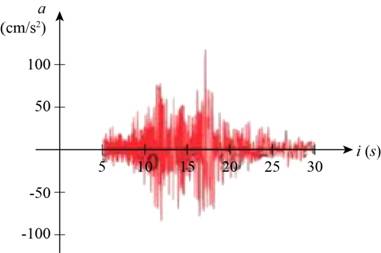
Figure (1)
The acceleration is given on vertical axis and the time in seconds on horizontal axis.
From Figure (1), it is noticed that the acceleration of ground is there right after 5 seconds.
Therefore, the first noticeable movement took place after 5 seconds.
(b)
At what time the earthquake ended.
Answer to Problem 44E
The earthquake ended after 30 seconds.
Explanation of Solution
A graph is given which shows the vertical acceleration of the ground from an earthquake as measured by a seismograph.
Figure (1)
From Figure (1), it is noticed that there is no acceleration of the ground after 30 seconds. It clearly means that the earthquake stopped after 30 seconds.
Therefore, the earthquake ended in 30 seconds.
(c)
At what time the earthquake had maximum intensity.
Answer to Problem 44E
The maximum intensity of the earthquake was reached after 17 seconds.
Explanation of Solution
A graph is given which shows the vertical acceleration of the ground from an earthquake as measured by a seismograph.
Figure (1)
Locate the local maximum point to find the time at which earthquake had the maximum intensity.
The value
From the Figure (1), it is noticed that the value of acceleration is maximum between
The acceleration is more than
This is the point of local maximum.
Therefore, the maximum intensity of the earthquake was reached after 17 seconds.
Chapter 2 Solutions
EBK PRECALCULUS: MATHEMATICS FOR CALCUL
Additional Math Textbook Solutions
College Algebra Essentials (5th Edition)
A First Course in Probability (10th Edition)
Precalculus: A Unit Circle Approach (3rd Edition)
Elementary & Intermediate Algebra
Beginning and Intermediate Algebra
Finite Mathematics for Business, Economics, Life Sciences and Social Sciences


- i need help pleasearrow_forwardQuestion 4 Find an equation of (a) The plane through the point (2, 0, 1) and perpendicular to the line x = y=2t, z=3+4t. 3t, (b) The plane through the point (3, −2, 8) and parallel to the plane z = x+y. (c) The plane that contains the line x = parallel to the plane 5x + 2y + z = 1. 1+t, y2t, z = 43t and is (d) The plane that passes through the point (1,2,3) and contains the line x = 3t, y=1+t, and z = 2 – t. (e) The plane that contains the lines L₁ : x = 1 + t, y = 1 − t, z = = L2 x 2s, y = s, z = 2. 2t andarrow_forwardcan you explain why the correct answer is Aarrow_forward
- See image for questionarrow_forwardFor this question, refer to the a1q4.py Python code that follows the assignment, as well as the dataprovided after the assignment.(a) Modify the code presented to plot the data from the two separate sets of information(from each region).(b) For each population of squirbos, let ` be the length of their front claws and s the mass ofthe skull. Determine for what value of m the s is isometric to `m. Justify it with your log − log plotsfrom (a) and suitable sketched lines.(c) What do you notice about the correlus striatus on your plot?(d) What historically might explain their situation?arrow_forwardPlease see image for question.arrow_forward
- Question 2 Find the shortest distance between the lines [x, y, z] = [1,0,4] + t[1, 3, −1] and [x, y, z] = [0,2,0] + s[2, 1, 1]. [Do not use derivatives.]arrow_forwardPlease see image for the questions.arrow_forwardUse the following graphs to evaluate the given one-sided limit. Answer exactly. y = f (x): y = g(x): 8 6 ν -8-6-4-2 2- 1-2-2 -4 -6 -8 ° 4 lim (f(x)+g(x)) = x+2+ 8 6 2 ν 0 x x 6 8 -8 -6-4-2 2 6 8 -2 -4 -6 -8arrow_forward
- Question 1 The points A = (-2, 3, 2) and B = (4, 1, 4) are reflections of one another in a plane S. Find an equation for S.arrow_forwardThe graph below is the function f (x) -D -3-2 4 3 2 Q2 03 Find lim f(x) = x-1- Find lim f(x) = x−1+ Find lim f(x) = x-1 Find f (-1) = 3 4 5arrow_forwardi circled the correct answer and i did most of the question but i cant figure out how to add both residues to get the correct answer could you please show me how to do itarrow_forward
 Calculus: Early TranscendentalsCalculusISBN:9781285741550Author:James StewartPublisher:Cengage Learning
 Thomas' Calculus (14th Edition)CalculusISBN:9780134438986Author:Joel R. Hass, Christopher E. Heil, Maurice D. WeirPublisher:PEARSON
 Calculus: Early Transcendentals (3rd Edition)CalculusISBN:9780134763644Author:William L. Briggs, Lyle Cochran, Bernard Gillett, Eric SchulzPublisher:PEARSON
 Calculus: Early TranscendentalsCalculusISBN:9781319050740Author:Jon Rogawski, Colin Adams, Robert FranzosaPublisher:W. H. Freeman
 Calculus: Early Transcendental FunctionsCalculusISBN:9781337552516Author:Ron Larson, Bruce H. EdwardsPublisher:Cengage Learning