Concept explainers
Videos
(a)
To describe: Whether the graph is function and if it is a function then whether it is one-to-one.
(a)
Explanation of Solution
The given graph is,
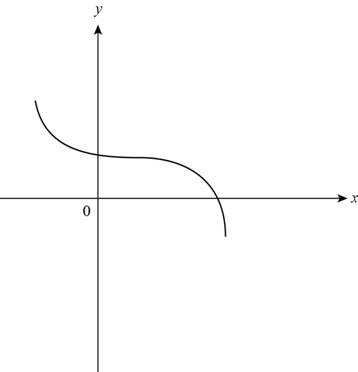
Figure (1)
Use vertical line test to find whether the given graph in Figure (1) is function or not.
Vertical line test states that, if a vertical line intersects the graph at more than one point than the graph is not a function.
Use horizontal line test to find whether the function is one-to-one.
Horizontal line states that if a horizontal line intersects the function more than once than the function is not one-to-one.
Draw a vertical line and horizontal line as shown below,
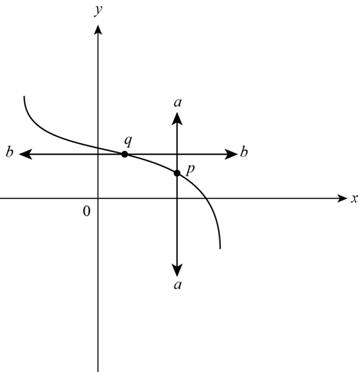
Figure (2)
From Figure (2) observe that line a intersect the graph at only one point p and line b intersect the graph of function at one point q.
The vertical line intersects at one point and horizontal line also intersects at one point.
Thus, the given graph is a function and it is one-to-one.
(b)
To describe: Whether the graph is function and if it is a function then whether it is one-to-one.
(b)
Explanation of Solution
The given graph is,
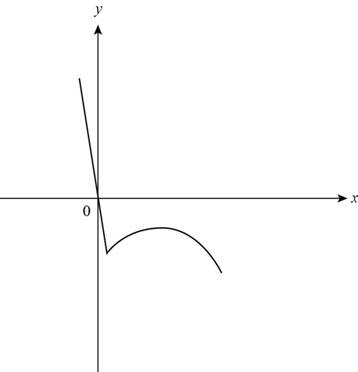
Figure (3)
Use vertical line test to find whether the given graph in Figure (1) is function or not.
Vertical line test states that, if a vertical line intersects the graph at more than one point than the graph is not a function.
Use horizontal line test to find whether the function is one-to-one.
Horizontal line states that if a horizontal line intersects the function more than once than the function is not one-to-one.
Draw a vertical line and a horizontal line as shown below,
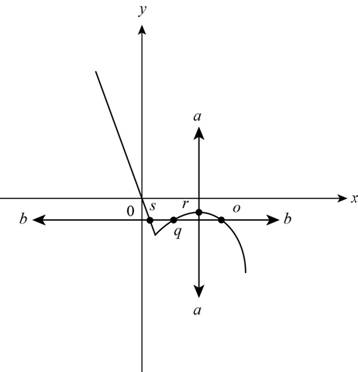
Figure (4)
From Figure (4) it can be observe that line a intersect at only one point r and line b intersect the function at three points s, q and p.
Vertical line intersects at only one point. So the graph is a function.
Horizontal line intersects at more than one point. So, the function is not one-to-one.
Thus, the given graph is a function but not one-to-one.
(c)
To describe: Whether the graph is function and if it is a function then whether it is one-to-one.
(c)
Explanation of Solution
The given graph is,
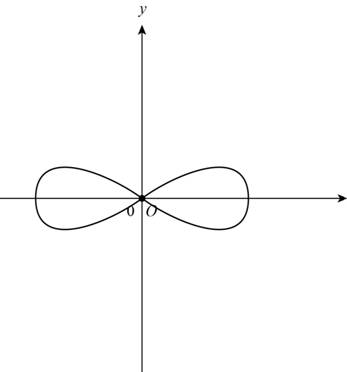
Figure (5)
Use vertical line test to find whether the given graph in Figure (5) is function or not.
Vertical line test states that, if a vertical line intersects the graph at more than one point than the graph is not a function.
Use horizontal line test to find whether the function is one-to-one.
Horizontal line states that if a horizontal line intersects the function more than once than the function is not one-to-one.
Draw a vertical line and a horizontal line as shown below,
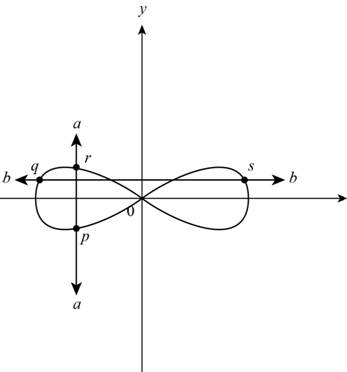
Figure (6)
From Figure (2) it can be observe that vertical line a intersect at points p and r. The horizontal line b intersect the function at points q and s.
So, vertical line intersects at more than one point and horizontal line also intersects at more than one point.
Thus, the given graph is not a function and not one-to-one.
(d)
To describe: Whether the graph is function and if it is a function then whether it is one-to-one.
(d)
Explanation of Solution
The given graph is,
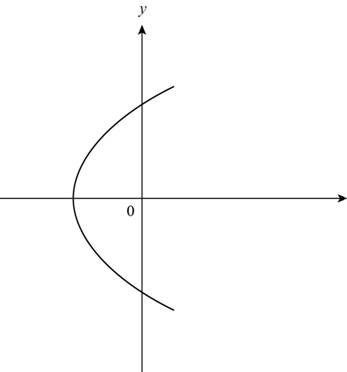
Figure (7)
Use vertical line test to find whether the given graph in Figure (7) is function or not.
Vertical line test states that, if a vertical line intersects the graph at more than one point than the graph is not a function.
Use horizontal line test to find whether the function is one-to-one.
Horizontal line states that if a horizontal line intersects the function more than once than the function is not one-to-one.
Draw a vertical line and horizontal line as shown below,
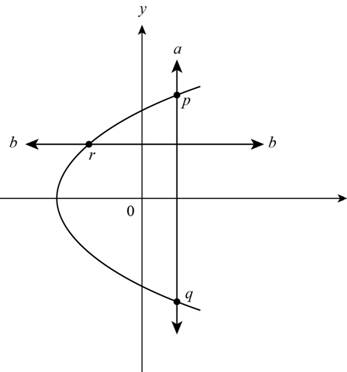
Figure (8)
From Figure (8) it can be observe that vertical line a intersects at two points p and q. The horizontal line b intersects the function at only one point r.
Vertical line intersects the graph at more than one point and horizontal line intersects at only one point.
Thus, the given graph is a not a function but one-to-one.
Chapter 2 Solutions
EBK PRECALCULUS: MATHEMATICS FOR CALCUL


- Find the Soultion to the following dy differential equation using Fourier in transforms: = , хуо, ухо according to the terms: lim u(x,y) = 0 x18 lim 4x (x,y) = 0 x14 2 u (x, 0) = =\u(o,y) = -y لوarrow_forwardCan you solve question 3,4,5 and 6 for this questionarrow_forwardwater at a rate of 2 m³/min. of the water height in this tank? 16) A box with a square base and an open top must have a volume of 256 cubic inches. Find the dimensions of the box that will minimize the amount of material used (the surface area). 17) A farmer wishes toarrow_forward
- #14 Sand pours from a chute and forms a conical pile whose height is always equal to its base diameter. The height o the pile increases at a rate of 5 feet/hour. Find the rate of change of the volume of the sand in the conical pile when the height of the pile is 4 feet.arrow_forward(d)(65in(x)-5 cos(x) dx mins by 5x-2x² 3x+1 dx -dx 20 Evaluate each the following indefinite integralsarrow_forward19 Evaluate each the following definite integrals: a) લ b) (+3) 6) (2-2)(+33) dxarrow_forward
- #11 If a snowball melts so its surface area decreases at a rate of 1cm²/min, find the rate at which the diameter decreases when the diameter is 6 cm.arrow_forwardUse Deritivitve of the inverse to solve thisarrow_forwardEvaluate the following Limits: e6x-1 Lim +0Sin3x 7x-5x2 2x-1+ Cos 4x +6 c) Lim b) Lim + x³-x2 X-0 1-e' 4x d) Lim 6x²-3 X+0 6x+2x² Find the derivatives of the following functions using the Limit definition of derivativearrow_forward
- 15A cylindrical tank with radius 8 m is being filled with water at a rate of 2 m³/min. What is the rate of change of the water height in this tank? 6)A box with a square base and an open top must box that will minimiarrow_forward#12 The radius of a sphere increases at a rate of 3 in/sec. How fast is the volume increasing when the diameter is 24arrow_forward84 256 cubic inches. Find the dimensions of the of material used (the surface area). A farmer wishes to enclose a rectangular plot using 200 m of fencing material. One side of the land borders a river and does not need fencing. What is the largest area that can be enclosed? For the function y=x³-3x²-1, use derivatives to: 3 b) 2x - 6x2 (a) determine the intarrow_forward
 Calculus: Early TranscendentalsCalculusISBN:9781285741550Author:James StewartPublisher:Cengage Learning
 Thomas' Calculus (14th Edition)CalculusISBN:9780134438986Author:Joel R. Hass, Christopher E. Heil, Maurice D. WeirPublisher:PEARSON
 Calculus: Early Transcendentals (3rd Edition)CalculusISBN:9780134763644Author:William L. Briggs, Lyle Cochran, Bernard Gillett, Eric SchulzPublisher:PEARSON
 Calculus: Early TranscendentalsCalculusISBN:9781319050740Author:Jon Rogawski, Colin Adams, Robert FranzosaPublisher:W. H. Freeman
 Calculus: Early Transcendental FunctionsCalculusISBN:9781337552516Author:Ron Larson, Bruce H. EdwardsPublisher:Cengage Learning