Concept explainers
a.
To graph:
Linear model for data using regression feature and find how closely models fits to data.
a.
Explanation of Solution
Give information:

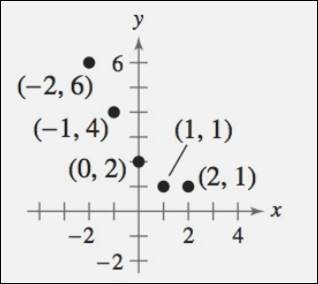
Graph:

Interpretation:
From the graph, data is written in tabulated form as below:
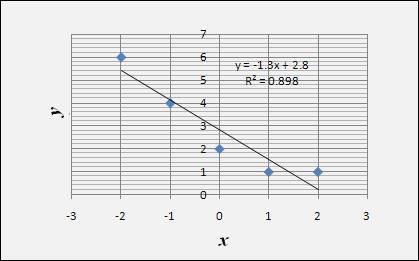
Using regression feature of the graphing utility linear model for the above tabulated data is as above.
So, best fit linear model is
b.
To calculate:
Linear model for data numerically and find how closely models fits to data.
b.
Answer to Problem 18E
Best fit linear model is
Explanation of Solution
Give information:

Calculation:
Regression line is
Above values can be tabulated as below:
| Given data | |||||
| Linear equation |
This model fits the data well.
Chapter 1 Solutions
Precalculus with Limits: A Graphing Approach
- Find the length of the following curve. 3 1 2 N x= 3 -y from y 6 to y=9arrow_forward3 4/3 3213 + 8 for 1 ≤x≤8. Find the length of the curve y=xarrow_forwardGiven that the outward flux of a vector field through the sphere of radius r centered at the origin is 5(1 cos(2r)) sin(r), and D is the value of the divergence of the vector field at the origin, the value of sin (2D) is -0.998 0.616 0.963 0.486 0.835 -0.070 -0.668 -0.129arrow_forward
- 10 The hypotenuse of a right triangle has one end at the origin and one end on the curve y = Express the area of the triangle as a function of x. A(x) =arrow_forwardIn Problems 17-26, solve the initial value problem. 17. dy = (1+ y²) tan x, y(0) = √√3arrow_forwardcould you explain this as well as disproving each wrong optionarrow_forward
- could you please show the computation of this by wiresarrow_forward4 Consider f(x) periodic function with period 2, coinciding with (x) = -x on the interval [,0) and being the null function on the interval [0,7). The Fourier series of f: (A) does not converge in quadratic norm to f(x) on [−π,π] (B) is pointwise convergent to f(x) for every x = R П (C) is in the form - 4 ∞ +Σ ak cos(kx) + bk sin(kx), ak ‡0, bk ‡0 k=1 (D) is in the form ak cos(kx) + bk sin(kx), ak 0, bk 0 k=1arrow_forwardSolve the equation.arrow_forward
 Calculus: Early TranscendentalsCalculusISBN:9781285741550Author:James StewartPublisher:Cengage Learning
 Thomas' Calculus (14th Edition)CalculusISBN:9780134438986Author:Joel R. Hass, Christopher E. Heil, Maurice D. WeirPublisher:PEARSON
 Calculus: Early Transcendentals (3rd Edition)CalculusISBN:9780134763644Author:William L. Briggs, Lyle Cochran, Bernard Gillett, Eric SchulzPublisher:PEARSON
 Calculus: Early TranscendentalsCalculusISBN:9781319050740Author:Jon Rogawski, Colin Adams, Robert FranzosaPublisher:W. H. Freeman
 Calculus: Early Transcendental FunctionsCalculusISBN:9781337552516Author:Ron Larson, Bruce H. EdwardsPublisher:Cengage Learning


