
Concept explainers
Videos
(a)
To graph: The
(a)
Explanation of Solution
Given information:
The populations
| Year | Population, |
Graph:
To graph the points on scatter plot, follow the steps using graphing calculator.
First press the
Go to
Now, press the
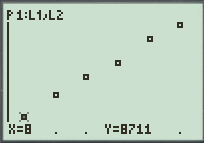
Figure (1)
(b)
To find: The linear model for the data with the help of regression of graphing utility.
(b)
Answer to Problem 23E
The linear model for the data is equal to
Explanation of Solution
Given information:
The populations
| Year | Population, |
Calculation:
For the regression linear model of data follow the steps below:
First press the
Go to
Now enter the keystrokes
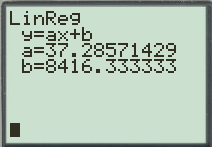
Figure(2)
Therefore, the linear model for the data is equal to
(c)
To find: The graph of model and the scatter plot of data in same viewing window and check the model is best fit or not.
(c)
Answer to Problem 23E
The model is best fit for the data as all the points of the data lies on the graph of the model.
Explanation of Solution
Given information:
The populations
| Year | Population, |
Calculation:
To graph the points on scatter plot, follow the steps using graphing calculator.
First press the
Go to
Now press the key
Now, press the
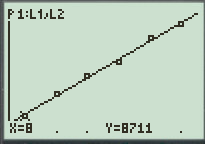
Figure (3)
(d)
To find: The table that shows the actual values of
(d)
Answer to Problem 23E
The table that shows the actual values of
| Year | Actual value of | Model value of |
Explanation of Solution
Given information:
The populations
| Year | Population, |
Calculation:
As found in part(b), the model for the best fit of data is equal to
Substitute
| Year | Actual value of | Model value of |
(e)
To find: The population of New Jersey in
(e)
Answer to Problem 23E
The population of New Jersey in
Explanation of Solution
Given information:
The populations
| Year | Population, |
Calculation:
As found in part(b), the model for the best fit of data is equal to
Substitute
Therefore, the population of New Jersey in
The answer to the population of New Jersey in
Chapter 1 Solutions
Precalculus with Limits: A Graphing Approach


- Please as many detarrow_forward8–23. Sketching vector fields Sketch the following vector fieldsarrow_forward25-30. Normal and tangential components For the vector field F and curve C, complete the following: a. Determine the points (if any) along the curve C at which the vector field F is tangent to C. b. Determine the points (if any) along the curve C at which the vector field F is normal to C. c. Sketch C and a few representative vectors of F on C. 25. F = (2½³, 0); c = {(x, y); y − x² = 1} 26. F = x (23 - 212) ; C = {(x, y); y = x² = 1}) , 2 27. F(x, y); C = {(x, y): x² + y² = 4} 28. F = (y, x); C = {(x, y): x² + y² = 1} 29. F = (x, y); C = 30. F = (y, x); C = {(x, y): x = 1} {(x, y): x² + y² = 1}arrow_forward
- ٣/١ B msl kd 180 Ka, Sin (1) I sin () sin(30) Sin (30) اذا ميريد شرح الكتب بس 0 بالفراغ 3) Cos (30) 0.866 4) Rotating 5) Synchronous speed, 120 x 50 G 5005 1000 s = 1000-950 Copper bosses 5kW Rotor input 5 0.05 : loo kw 6) 1 /0001 ined sove in peaper I need a detailed solution on paper please وه اذا ميريد شرح الكتب فقط ١٥٠ DC 7) rotor a ' (y+xlny + xe*)dx + (xsiny + xlnx + dy = 0. Q1// Find the solution of: ( 357arrow_forward۳/۱ R₂ = X2 2) slots per pole per phase 3/31 B. 180 msl Kas Sin (I) 1sin() sin(30) Sin (30) اذا ميريد شرح الكتب بس 0 بالفراغ 3) Cos (30): 0.866 4) Rotating 5) Synchronous speeds 120×50 looo G 1000-950 1000 Copper losses 5kw Rotor input 5 loo kw 0.05 6) 1 اذا ميريد شرح الكتب فقط look 7) rotor DC ined sove in peaper I need a detailed solution on paper please 0 64 Find the general solution of the following equations: QI//y(4)-16y= 0. Find the general solution of the following equations: Q2ll yll-4y/ +13y=esinx.arrow_forwardR₂ = X2 2) slots per pole per phase = 3/31 B-180 60 msl kd Kas Sin () 2 I sin (6) sin(30) Sin (30) اذا مريد شرح الكتب بس 0 بالفراغ 3 Cos (30) 0.866 4) Rotating ined sove in peaper 5) Synchronous speed s 120×50 6 s = 1000-950 1000 Copper losses 5kw Rotor input 5 0.05 6) 1 loo kw اذا ميريد شرح الكتب فقط Look 7) rotov DC I need a detailed solution on paper please 0 64 Solve the following equations: 0 Q1// Find the solution of: ( y • with y(0) = 1. dx x²+y²arrow_forward
- R₂ = X2 2) slots per pole per phase = 3/3 1 B-180-60 msl Ka Sin (1) Isin () sin(30) Sin (30) اذا ميريد شرح الكتب بس 0 بالفراغ 3) Cos (30) 0.866 4) Rotating 5) Synchronous speed, 120 x 50 s = 1000-950 1000 Copper losses 5kw Rotor input 5 6) 1 0.05 G 50105 loo kw اذا ميريد شرح الكتب فقط look 7) rotov DC ined sove in peaper I need a detailed solution on paper please 064 2- A hot ball (D=15 cm ) is cooled by forced air T.-30°C, the rate of heat transfer from the ball is 460.86 W. Take for the air -0.025 Wim °C and Nu=144.89, find the ball surface temperature a) 300 °C 16 b) 327 °C c) 376 °C d) None か = 750 01arrow_forwardDon't do 14. Please solve 19arrow_forwardPlease solve 14 and 15arrow_forward
- 1. Consider the following system of equations: x13x2 + 4x3 - 5x4 = 7 -2x13x2 + x3 - 6x4 = 7 x16x213x3 - 21x4 = 28 a) Solve the system. Write your solution in parametric and vector form. b) What is a geometric description of the solution. 7 c) Is v = 7 in the span of the set S= [28. 1 HE 3 -5 3 ·6 ? If it is, write v 6 as a linear combination of the vectors in S. Justify. d) How many solutions are there to the associated homogeneous system for the system above? Justify. e) Let A be the coefficient matrix from the system above. Find the set of all solutions to Ax = 0. f) Is there a solution to Ax=b for all b in R³? Justify.arrow_forward4. Suppose that A is made up of 5 column vectors in R³, and suppose that the rank(A)=3. a. How many solutions are there to Ax=0? Justify. b. What is a geometric description for the nullspace(A)? Justify. c. Do the column vectors of A span R³? Justify. d. Is A invertible? Justify.arrow_forward3. Suppose that A is 5 x 5 and rank(A)=4. Use this information to answer the following. a. Give a geometric description of nullspace(A). Justify. b. Is A invertible? Justify. c. Give a geometric description of the span of the column vectors of A. What space are the column vectors of A in? Justify. d. What is determinant of A? Justify.arrow_forward
 Calculus: Early TranscendentalsCalculusISBN:9781285741550Author:James StewartPublisher:Cengage Learning
 Thomas' Calculus (14th Edition)CalculusISBN:9780134438986Author:Joel R. Hass, Christopher E. Heil, Maurice D. WeirPublisher:PEARSON
 Calculus: Early Transcendentals (3rd Edition)CalculusISBN:9780134763644Author:William L. Briggs, Lyle Cochran, Bernard Gillett, Eric SchulzPublisher:PEARSON
 Calculus: Early TranscendentalsCalculusISBN:9781319050740Author:Jon Rogawski, Colin Adams, Robert FranzosaPublisher:W. H. Freeman
 Calculus: Early Transcendental FunctionsCalculusISBN:9781337552516Author:Ron Larson, Bruce H. EdwardsPublisher:Cengage Learning