
Concept explainers
Videos
a.
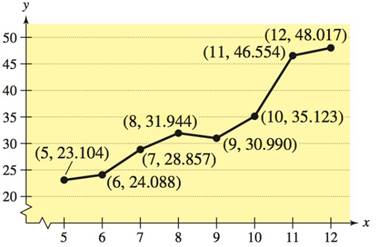
Calculate the years in which the sales showed the great increase and greatest decrease by seeing the slope.
a.
Answer to Problem 87E
The greatest increase is $
Explanation of Solution
Given: It is given in the question that the graph shows the sales y (in billions of dollars) of the Coca − cola Company each year x from

Concept Used:
In this , use the concept of graph analysis that how to read the graph data and by this calculate the question.
Calculation: Firstly , take the each year and calculate the slope and by this we easily get the lowest and the greatest.
| YEARS | SLOPE |
|
|
|
|
|
|
|
|
|
|
|
|
|
|
|
|
|
|
|
|
|
So , by seeing the table we find that the greatest increase was $
The greatest decrease was $
Conclusion:
The greatest increase is $
b.
Calculate the equation of the line between the years
b.
Answer to Problem 87E
The equation of the line between the years is
Explanation of Solution
Given: It is given in the question that the graph shows the sales y (in billions of dollars) of the Coca − cola Company each year x from

Concept Used:
In this , use the concept of slope formula and point slope form the formula used is
Calculation:
By using the points
The slope is
Now, using the point slope form to get the equation:
Conclusion:
The equation is
c.
Identify the meaning of the slope of the line grom part (b) in the context of the problem.
c.
Answer to Problem 87E
The slope in the equation means that there was an average increase in sales of about
Explanation of Solution
Given: It is given in the question that the graph shows the sales y (in billions of dollars) of the Coca − cola Company each year x from

Concept Used:
In this, use the concept to read and understand the equation and get the answer from it.
Calculation: The equation that get from part (b) is
From the equation it is concluded that there was an average increase in sales of about
Conclusion:
It is conclude that the average sales is
d.
Find the sales of the Coca − cola company in
d.
Answer to Problem 87E
The approximate sales of the Coca − Cola Company in 2017 is
Explanation of Solution
Given: It is given in the question that the graph shows the sales y (in billions of dollars) of the Coca − cola Company each year x from
Concept Used:
In this, use the concept of putting the value in the equation and finding the answer.
Calculation: Here, in part (b) the equation will be
Now ,put
It is not the accurate sale as the seasonal changes may affect the sale of the product.
Conclusion:
The approximate sales in 2017 is
Chapter 1 Solutions
Precalculus with Limits: A Graphing Approach


- Calculus lll May I please have the all properties of the dot product? Thank youarrow_forwardFind the tangent line approximation 7 to the graph of f at the given point. T(x) = f(x) = csc(x), (8, csc(8)) Complete the table. (Round your answers to four decimal places.) x f(x) T(x) 7.9 7.99 8 8.01 8.1arrow_forwardCan you solve it numerical methodarrow_forward
- Use the information to find and compare Ay and dy. (Round your answers to four decimal places.) Function x-Value Differential of x Ду = dy = y = x² + 2 x = -4 Ax = dx = 0.01arrow_forwardCalculus lll May I please have the statements with blank lines completed; furthermore, may I please have the text box completed? Thank youarrow_forwardCalculus lll May I please have the statements completed for the following text lines and box? Thank you so much,arrow_forward
- Calculus lll May I please have the solution for the following exercise? Thank you so mucharrow_forwardCalculus lll May I please have the solution for the following exercise? Thank you so much,arrow_forwardCalculus lll May I please have the solution for the following exercise? Thank you so mucharrow_forward
- Calculus lll May I please have the solution for the following example? Thank youarrow_forwardCalculus lll May I please have the statement completed for the following box? Thank you so much,arrow_forwardCalculus lll May I please have the solution for the following exercise? Thank you so mucharrow_forward
 Calculus: Early TranscendentalsCalculusISBN:9781285741550Author:James StewartPublisher:Cengage Learning
 Thomas' Calculus (14th Edition)CalculusISBN:9780134438986Author:Joel R. Hass, Christopher E. Heil, Maurice D. WeirPublisher:PEARSON
 Calculus: Early Transcendentals (3rd Edition)CalculusISBN:9780134763644Author:William L. Briggs, Lyle Cochran, Bernard Gillett, Eric SchulzPublisher:PEARSON
 Calculus: Early TranscendentalsCalculusISBN:9781319050740Author:Jon Rogawski, Colin Adams, Robert FranzosaPublisher:W. H. Freeman
 Calculus: Early Transcendental FunctionsCalculusISBN:9781337552516Author:Ron Larson, Bruce H. EdwardsPublisher:Cengage Learning