
Concept explainers
Videos
a.
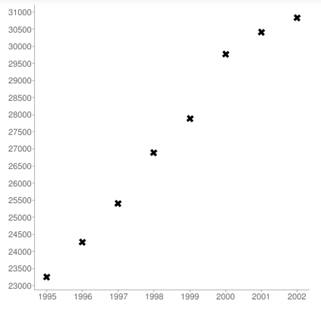
To graph: the data on the
a.
Answer to Problem 7E
Explanation of Solution
Given information:
The table of values given is as follows:
| Year (x) | Personal income in dollar (y) |
| 1995 | 23255 |
| 1996 | 24270 |
| 1997 | 25412 |
| 1998 | 26893 |
| 1999 | 27880 |
| 2000 | 29760 |
| 2001 | 30413 |
| 2002 | 30832 |
| 2010 | ? |
Calculation:
The graph for the given data is shown below.

b.
To find: best fit line using two ordered pairs.
b.
Answer to Problem 7E
Explanation of Solution
Given information:
The table of values given is as follows:
| Year (x) | Personal income in dollar (y) |
| 1995 | 23255 |
| 1996 | 24270 |
| 1997 | 25412 |
| 1998 | 26893 |
| 1999 | 27880 |
| 2000 | 29760 |
| 2001 | 30413 |
| 2002 | 30832 |
| 2010 | ? |
Calculation:
Let’s select any two ordered pair like
Now, plug the value of m and any one point coordinate into the slope intercept equation and evaluate b as follows:
Now, plug the values of m and b in the slope intercept formula as follows:
Thus, the line equation is
c.
To find: the equation for
c.
Answer to Problem 7E
Explanation of Solution
Given information:
The table of values given is as follows:
| Year (x) | Personal income in dollar (y) |
| 1995 | 23255 |
| 1996 | 24270 |
| 1997 | 25412 |
| 1998 | 26893 |
| 1999 | 27880 |
| 2000 | 29760 |
| 2001 | 30413 |
| 2002 | 30832 |
| 2010 | ? |
Calculation:
The graph for the above equation is as follows:
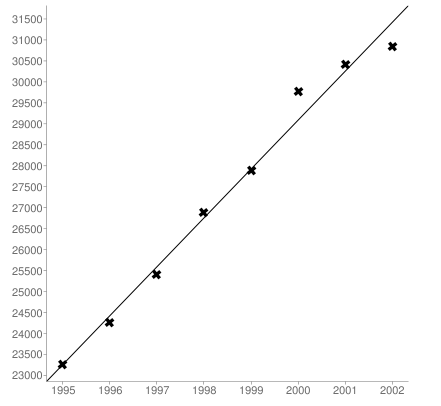
Using the graphing calculator, the regression line equation is as follows:
Using the graphing calculator, the
d.
To find: the missing value if regression line equation has strong or moderate relationship, and explains whether the prediction is reliable.
d.
Answer to Problem 7E
Prediction is reliable.
Explanation of Solution
Given information:
The table of values given is as follows:
| Year (x) | Personal income in dollar (y) |
| 1995 | 23255 |
| 1996 | 24270 |
| 1997 | 25412 |
| 1998 | 26893 |
| 1999 | 27880 |
| 2000 | 29760 |
| 2001 | 30413 |
| 2002 | 30832 |
| 2010 | ? |
Calculation:
The equation of regression line shows strong relationship because
Plugging
The regression line represents that the rate of increase in personal income per year is slower than that of inflation. On average, money doubles every seven years. As minimum wage does not increase quickly as compared to inflation and only a small fraction of the population has the large amount of money. So, this data seems reliable and the predicted value is also reliable.
Chapter 1 Solutions
Advanced Mathematical Concepts: Precalculus with Applications, Student Edition
Additional Math Textbook Solutions
University Calculus: Early Transcendentals (4th Edition)
Using and Understanding Mathematics: A Quantitative Reasoning Approach (6th Edition)
A Problem Solving Approach To Mathematics For Elementary School Teachers (13th Edition)
A First Course in Probability (10th Edition)
Calculus: Early Transcendentals (2nd Edition)


- Solve please and thank you!arrow_forwardSolve please and thanks!arrow_forwardThe graph of the function f in the figure below consists of line segments and a semicircle. Let g be the function given by x 9(x) = * f(t)dt. Determine all values of r, if any, where g has a relative minimum on the open interval (-9, 9). y 8 7 6 5 4 32 1 Graph of f x -10 -9 -8 -7 -6 -5 -4 -3 -2 -1 1 2 3 4 5 6 7 8 9 10 -1 -2 -3 -4 -5 -6 678 -7 -8arrow_forward
- Solve pleasearrow_forwardA particle moves along the x-axis for 0 < t < 18 such that its velocity is given by the graph shown below. Find the total distance traveled by the particle during the time interval 4 ≤ t ≤ 8. 8 y 7 6 5 4 32 1 6 7 -1 1 2 3 4 5 -1 -2 -3 -4 56 -6 -8 8 00 Graph of v(t) x 9 10 11 12 13 14 15 16 17 18 19arrow_forwardUsing the Chain rule please and thank youarrow_forward
- 10. [-/3 Points] DETAILS MY NOTES SESSCALCET2 7.2.047. Consider the following. aR- br (a) Set up an integral for the volume a solid torus (the donut-shaped solid shown in the figure) with radii br and aR. (Let a 8 and b = 2.) = dy (b) By interpreting the integral as an area, find the volume V of the torus. V = Need Help? Read It Watch Itarrow_forwardGraph y= log(x − 1) +4 10+ 9 8 7 6 5 4 32 1 10 -9 -8 -7 -6 -5 -4 -3 -2 -1 1 2 3 4 5 -1 6 7 8 9 10 -2 -3 -4 -5 -6 -7 -8 -9 -10arrow_forwardWrite an equation for the graph shown below. 5 4 3 2 1 -5-4-3-2-1 -1 1 2 3 4 5 f(x) = -2 -3 -4 -5arrow_forward
 Calculus: Early TranscendentalsCalculusISBN:9781285741550Author:James StewartPublisher:Cengage Learning
 Thomas' Calculus (14th Edition)CalculusISBN:9780134438986Author:Joel R. Hass, Christopher E. Heil, Maurice D. WeirPublisher:PEARSON
 Calculus: Early Transcendentals (3rd Edition)CalculusISBN:9780134763644Author:William L. Briggs, Lyle Cochran, Bernard Gillett, Eric SchulzPublisher:PEARSON
 Calculus: Early TranscendentalsCalculusISBN:9781319050740Author:Jon Rogawski, Colin Adams, Robert FranzosaPublisher:W. H. Freeman
 Calculus: Early Transcendental FunctionsCalculusISBN:9781337552516Author:Ron Larson, Bruce H. EdwardsPublisher:Cengage Learning