
Concept explainers
Videos
a.
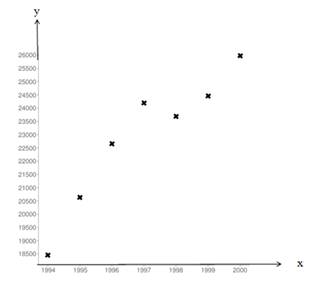
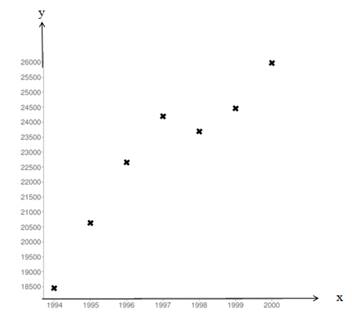
To graph: the given data on
a.
Answer to Problem 53SGA
Explanation of Solution
Given information:
| Year | 1994 | 1995 | 1996 | 1997 | 1998 | 1999 | 2000 | 2008 |
| Visitors | 18458 | 20639 | 22658 | 24194 | 23698 | 24466 | 25975 | ? |
Calculation:
Let the year be x and the number of visitors be y. Plot of the graph from the given data will be as follows:
b.
To find: the equation of a best fit line by using two ordered pairs.
b.
Answer to Problem 53SGA
Explanation of Solution
Given information:
| Year | 1994 | 1995 | 1996 | 1997 | 1998 | 1999 | 2000 | 2008 |
| Visitors | 18458 | 20639 | 22658 | 24194 | 23698 | 24466 | 25975 | ? |
Calculation:
Select any two ordered pairs like
Put any point coordinate and slope value into the slope intercept formula and evaluate the y -intercept as follows:
Now, put the values of slope and b into the slope intercept formula as follows:
Thus, the equation is
c.
To find: the equation of regression line and its
c.
Answer to Problem 53SGA
Explanation of Solution
Given information:
| Year | 1994 | 1995 | 1996 | 1997 | 1998 | 1999 | 2000 | 2008 |
| Visitors | 18458 | 20639 | 22658 | 24194 | 23698 | 24466 | 25975 | ? |
Calculation:
From the graph
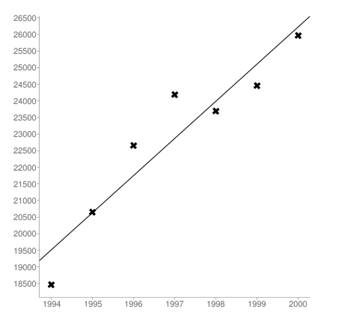
By using the graphing calculator, we get slope value as 1115.8928571429 and intercept value as
Now, put the values in the following equation and evaluate regression of equation of line
Thus, the regression line equation is,
By using graphing calculator, the value of
d.
To explain: the whether the relationship predicted by the equation for the number of visitors in 2008 is reliable.
d.
Answer to Problem 53SGA
35 million
Explanation of Solution
Given information:
| Year | 1994 | 1995 | 1996 | 1997 | 1998 | 1999 | 2000 | 2008 |
| Visitors | 18458 | 20639 | 22658 | 24194 | 23698 | 24466 | 25975 | ? |
Calculation:
Since
Putting the value of
This suggests that each year more and more people visit the U.S from overseas. The reason behind the steadily increasing number of visitors is not known. It may be due to increase in population, more people travel, or maybe travel to U.S is easier.
35 million visitors seem like a reasonable number. It doesn't exceed the world population.
Chapter 1 Solutions
Advanced Mathematical Concepts: Precalculus with Applications, Student Edition
Additional Math Textbook Solutions
University Calculus: Early Transcendentals (4th Edition)
Introductory Statistics
Pre-Algebra Student Edition
Thinking Mathematically (6th Edition)
A First Course in Probability (10th Edition)
A Problem Solving Approach To Mathematics For Elementary School Teachers (13th Edition)


- (14 points) Let S = {(x, y, z) | z = e−(x²+y²), x² + y² ≤ 1}. The surface is the graph of ze(+2) sitting over the unit disk.arrow_forward6. Solve the system of differential equations using Laplace Transforms: x(t) = 3x₁ (t) + 4x2(t) x(t) = -4x₁(t) + 3x2(t) x₁(0) = 1,x2(0) = 0arrow_forward3. Determine the Laplace Transform for the following functions. Show all of your work: 1-t, 0 ≤t<3 a. e(t) = t2, 3≤t<5 4, t≥ 5 b. f(t) = f(tt)e-3(-) cos 4τ drarrow_forward
- 4. Find the inverse Laplace Transform Show all of your work: a. F(s) = = 2s-3 (s²-10s+61)(5-3) se-2s b. G(s) = (s+2)²arrow_forward1. Consider the differential equation, show all of your work: dy =(y2)(y+1) dx a. Determine the equilibrium solutions for the differential equation. b. Where is the differential equation increasing or decreasing? c. Where are the changes in concavity? d. Suppose that y(0)=0, what is the value of y as t goes to infinity?arrow_forward2. Suppose a LC circuit has the following differential equation: q'+4q=6etcos 4t, q(0) = 1 a. Find the function for q(t), use any method that we have studied in the course. b. What is the transient and the steady-state of the circuit?arrow_forward
- 5. Use variation of parameters to find the general solution to the differential equation: y" - 6y' + 9y=e3x Inxarrow_forwardLet the region R be the area enclosed by the function f(x) = ln (x) + 2 and g(x) = x. Write an integral in terms of x and also an integral in terms of y that would represent the area of the region R. If necessary, round limit values to the nearest thousandth. 5 4 3 2 1 y x 1 2 3 4arrow_forward(28 points) Define T: [0,1] × [−,0] → R3 by T(y, 0) = (cos 0, y, sin 0). Let S be the half-cylinder surface traced out by T. (a) (4 points) Calculate the normal field for S determined by T.arrow_forward
- (14 points) Let S = {(x, y, z) | z = e−(x²+y²), x² + y² ≤ 1}. The surface is the graph of ze(+2) sitting over the unit disk. = (a) (4 points) What is the boundary OS? Explain briefly. (b) (4 points) Let F(x, y, z) = (e³+2 - 2y, xe³±² + y, e²+y). Calculate the curl V × F.arrow_forward(6 points) Let S be the surface z = 1 − x² - y², x² + y² ≤1. The boundary OS of S is the unit circle x² + y² = 1. Let F(x, y, z) = (x², y², z²). Use the Stokes' Theorem to calculate the line integral Hint: First calculate V x F. Jos F F.ds.arrow_forward(28 points) Define T: [0,1] × [−,0] → R3 by T(y, 0) = (cos 0, y, sin 0). Let S be the half-cylinder surface traced out by T. (a) (4 points) Calculate the normal field for S determined by T.arrow_forward
 Calculus: Early TranscendentalsCalculusISBN:9781285741550Author:James StewartPublisher:Cengage Learning
 Thomas' Calculus (14th Edition)CalculusISBN:9780134438986Author:Joel R. Hass, Christopher E. Heil, Maurice D. WeirPublisher:PEARSON
 Calculus: Early Transcendentals (3rd Edition)CalculusISBN:9780134763644Author:William L. Briggs, Lyle Cochran, Bernard Gillett, Eric SchulzPublisher:PEARSON
 Calculus: Early TranscendentalsCalculusISBN:9781319050740Author:Jon Rogawski, Colin Adams, Robert FranzosaPublisher:W. H. Freeman
 Calculus: Early Transcendental FunctionsCalculusISBN:9781337552516Author:Ron Larson, Bruce H. EdwardsPublisher:Cengage Learning