
Concept explainers
Videos
The
two signals, one due to the
absorption. (b) Do the
(a)
Interpretation: The chemical shifts of the given absorptions are to be calculated.
Concept introduction: In NMR spectrum, peaks are known as resonances, lines or absorptions. On the horizontal axis, the position of absorption is generally referred to as chemical shift. The chemical shift of any absorption is calculated by the formula,
Answer to Problem 14.1P
The chemical shifts of the given absorptions are
Explanation of Solution
The observed chemical shift due to the
The observed chemical shift due to the
The operating frequency is
The conversion of
Therefore, the conversion of
Chemical shift
Chemical shift due to
The chemical shift of absorption is calculated by the formula,
Where,
Substitute the values of observed chemical shift and operating frequency in the above formula to calculate the chemical shift due to
Therefore, the chemical shift is
The conversion of
Therefore, the conversion of
Hence, the chemical shift is
Chemical shift due to
Substitute the values of observed chemical shift and operating frequency in the above formula to calculate the chemical shift due to
Therefore, the chemical shift is
The conversion of
Therefore, the conversion of
Hence, the chemical shift is
The chemical shifts of the given absorptions are
(b)
Interpretation: Whether the
Concept introduction: In NMR spectrum, peaks are known as resonances, lines or absorptions. On the horizontal axis, the position of absorption is generally referred to as chemical shift. The increasing order of chemical shift is plotted from right to left in NMR spectrum.
Answer to Problem 14.1P
The peak of
Explanation of Solution
The terms, upfield and downfield expresses the relative location of signals. The meaning of upfield is to the right and of downfield is to the left. The
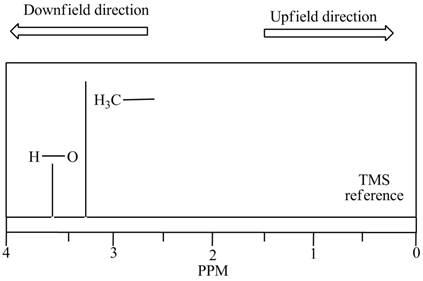
Figure 1
Hence, the peak of
The peak of
Want to see more full solutions like this?
Chapter 14 Solutions
Organic Chemistry
Additional Science Textbook Solutions
General, Organic, and Biological Chemistry - 4th edition
Applications and Investigations in Earth Science (9th Edition)
HUMAN ANATOMY
Physical Science
Biology: Concepts and Investigations


- Homework 13 (Ch17) Question 4 of 4 (1 point) | Question Attempt: 2 of 2 ✓ 1 ✓ 2 = 3 4 Time Remaining: 4:25:54 Using the thermodynamic information in the ALEKS Data tab, calculate the standard reaction free energy of the following chemical reaction: 2CH3OH (g)+302 (g) → 2CO2 (g) + 4H₂O (g) Round your answer to zero decimal places. ☐ kJ x10 ☐ Subm Check 2020 Hill LLC. All Rights Reserved. Terms of Use | Privacy Cearrow_forwardIdentifying the major species in weak acid or weak base equilibria Your answer is incorrect. • Row 2: Your answer is incorrect. • Row 3: Your answer is incorrect. • Row 6: Your answer is incorrect. 0/5 The preparations of two aqueous solutions are described in the table below. For each solution, write the chemical formulas of the major species present at equilibrium. You can leave out water itself. Write the chemical formulas of the species that will act as acids in the 'acids' row, the formulas of the species that will act as bases in the 'bases' row, and the formulas of the species that will act as neither acids nor bases in the 'other' row. You will find it useful to keep in mind that HF is a weak acid. acids: HF 0.1 mol of NaOH is added to 1.0 L of a 0.7M HF solution. bases: 0.13 mol of HCl is added to 1.0 L of a solution that is 1.0M in both HF and KF. Exponent other: F acids: HF bases: F other: K 1 0,0,... ? 000 18 Ararrow_forwardUsing reaction free energy to predict equilibrium composition Consider the following equilibrium: 2NOCI (g) 2NO (g) + Cl2 (g) AGº =41. kJ Now suppose a reaction vessel is filled with 4.50 atm of nitrosyl chloride (NOCI) and 6.38 atm of chlorine (C12) at 212. °C. Answer the following questions about this system: ? rise Under these conditions, will the pressure of NOCI tend to rise or fall? x10 fall Is it possible to reverse this tendency by adding NO? In other words, if you said the pressure of NOCI will tend to rise, can that be changed to a tendency to fall by adding NO? Similarly, if you said the pressure of NOCI will tend to fall, can that be changed to a tendency to rise by adding NO? yes no If you said the tendency can be reversed in the second question, calculate the minimum pressure of NO needed to reverse it. Round your answer to 2 significant digits. 0.035 atm ✓ G 00. 18 Ararrow_forward
- Highlight each glycosidic bond in the molecule below. Then answer the questions in the table under the drawing area. HO- HO- -0 OH OH HO NG HO- HO- OH OH OH OH NG OHarrow_forward€ + Suppose the molecule in the drawing area below were reacted with H₂ over a platinum catalyst. Edit the molecule to show what would happen to it. That is, turn it into the product of the reaction. Also, write the name of the product molecule under the drawing area. Name: ☐ H C=0 X H- OH HO- H HO- -H CH₂OH ×arrow_forwardDraw the Haworth projection of the disaccharide made by joining D-glucose and D-mannose with a ẞ(1-4) glycosidic bond. If the disaccharide has more than one anomer, you can draw any of them. Click and drag to start drawing a structure. Xarrow_forward
- Epoxides can be opened in aqueous acid or aqueous base to produce diols (molecules with two OH groups). In this question, you'll explore the mechanism of epoxide opening in aqueous acid. 2nd attempt Be sure to show all four bonds at stereocenters using hash and wedge lines. 0 0 Draw curved arrows to show how the epoxide reacts with hydronium ion. 100 +1: 1st attempt Feedback Be sure to show all four bonds at stereocenters using hash and wedge lines. See Periodic Table See Hint H A 5 F F Hr See Periodic Table See Hintarrow_forward03 Question (1 point) For the reaction below, draw both of the major organic products. Be sure to consider stereochemistry. > 1. CH₂CH₂MgBr 2. H₂O 3rd attempt Draw all four bonds at chiral centers. Draw all stereoisomers formed. Draw the structures here. e 130 AN H See Periodic Table See Hint P C Brarrow_forwardYou may wish to address the following issues in your response if they are pertinent to the reaction(s) you propose to employ:1) Chemoselectivity (why this functional group and not another?) 2) Regioselectivity (why here and not there?) 3) Stereoselectivity (why this stereoisomer?) 4) Changes in oxidation state. Please make it in detail and draw it out too in what step what happens. Thank you for helping me!arrow_forward
- 1) Chemoselectivity (why this functional group and not another?) 2) Regioselectivity (why here and not there?) 3) Stereoselectivity (why this stereoisomer?) 4) Changes in oxidation state. Everything in detail and draw out and write it.arrow_forwardCalculating the pH at equivalence of a titration 3/5 Izabella A chemist titrates 120.0 mL of a 0.7191M dimethylamine ((CH3)2NH) solution with 0.5501 M HBr solution at 25 °C. Calculate the pH at equivalence. The pk of dimethylamine is 3.27. Round your answer to 2 decimal places. Note for advanced students: you may assume the total volume of the solution equals the initial volume plus the volume of HBr solution added. pH = ☐ ✓ 18 Ar Boarrow_forwardAlcohols can be synthesized using an acid-catalyzed hydration of an alkene. An alkene is combined with aqueous acid (e.. sulfuric acid in water). The reaction mechanism typically involves a carbocation intermediate. > 3rd attempt 3343 10 8 Draw arrows to show the reaction between the alkene and hydronium ion. that 2nd attempt Feedback 1st attempt تعمال Ju See Periodic Table See Hint F D Ju See Periodic Table See Hintarrow_forward

 Principles of Instrumental AnalysisChemistryISBN:9781305577213Author:Douglas A. Skoog, F. James Holler, Stanley R. CrouchPublisher:Cengage Learning