Concept explainers
Videos
Consider the following pH curves for 100.0 mL of two different acids with the same initial concentration each titrated by 0.10 M NaOH.
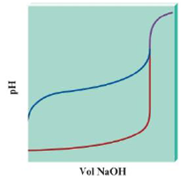
a. Which plot represents a pH curve of a weak acid, and which plot is for a strong acid? How can you tell? Cite three differences between the plots that help you decide.
b. In both cases the pH is relatively constant before the pH changes greatly. Does this mean that at some point in each titration each solution was a buffered solution?
c. True or false? The equivalence point volume for each titration is the same. Explain your answer.
d. True or false? The pH at the equivalence point for each titration is the same. Explain your answer.
Want to see the full answer?
Check out a sample textbook solution
Chapter 14 Solutions
Chemistry: An Atoms First Approach
Additional Science Textbook Solutions
Biology: Life on Earth with Physiology (11th Edition)
Campbell Essential Biology (7th Edition)
General, Organic, and Biological Chemistry - 4th edition
Organic Chemistry
Campbell Biology (11th Edition)


- 10. Stereochemistry. Assign R/S stereochemistry for the chiral center indicated on the following compound. In order to recieve full credit, you MUST SHOW YOUR WORK! H₂N CI OH CI カー 11. () Stereochemistry. Draw all possible stereoisomers of the following compound. Assign R/S configurations for all stereoisomers and indicate the relationship between each as enantiomer, diastereomer, or meso. NH2 H HNH, -18arrow_forwardb) 8. Indicate whether the following carbocation rearrangements are likely to occur Please explain your rational using 10 words or less not likely to occur • The double bond is still in the Same position + Likely to oc occur WHY? -3 H3C Brave Chair Conformers. Draw the chair conformer of the following substituted cyclohexane. Peform a RING FLIP and indicate the most stable conformation and briefly explain why using 20 words or less. CI 2 -cobs ?? MUST INDICATE H -2 -2 Br EQ Cl OR AT Br H& most stable WHY? - 4arrow_forwardCH 12 Conformational Analysis. Draw all 6 conformers (one above each letter) of the compound below looking down the indicated bond. Write the letter of the conformer with the HIGHEST and LOWEST in energies on the lines provided. NOTE: Conformer A MUST be the specific conformer of the structure as drawn below -4 NOT HOH OH 3 Conformer A: Br OH A Samo Br H 04 Br H H3 CH₂ H anti stagere Br CH clipsed H Brott H IV H MISSING 2 -2 B C D E F X 6 Conformer with HIGHEST ENERGY: 13. (1 structure LOWEST ENERGY: Nomenclature. a) Give the systematic (IUPAC) name structure. b) Draw the corresponding to this name. HINT: Do not forget to indicate stereochemistry when applicable. a) ८८ 2 "Br {t༐B,gt)-bemn€-nehpརི་ཚ༐lnoa Parent name (noname) 4 Bromo Sub = 2-methylethyl-4 Bromo nonane b) (3R,4S)-3-chloro-4-ethyl-2,7-dimethyloctane # -2 -2arrow_forward
- in the scope of the SCH4U course! please show all steps as im still learning how to format my answers in the format given, thank you!arrow_forwardhelp me solve this HWarrow_forwardMolecules of the form AH2 can exist in two potential geometries: linear or bent. Construct molecular orbital diagrams for linear and bent CH2. Identify the relevant point group, include all of the appropriate symmetry labels and pictures, and fill in the electrons. Which geometry would you predict to be more stable, and why? (Please draw out the diagram and explain)arrow_forward
- Indicate the variation in conductivity with concentration in solutions of strong electrolytes and weak electrolytes.arrow_forwardThe molar conductivity of a very dilute solution of NaCl has been determined. If it is diluted to one-fourth of the initial concentration, qualitatively explain how the molar conductivity of the new solution will compare with the first.arrow_forwardWhat does the phrase mean, if instead of 1 Faraday of electricity, Q coulombs (Q/F Faradays) pass through?arrow_forward
 Chemistry: The Molecular ScienceChemistryISBN:9781285199047Author:John W. Moore, Conrad L. StanitskiPublisher:Cengage Learning
 Chemistry: Principles and PracticeChemistryISBN:9780534420123Author:Daniel L. Reger, Scott R. Goode, David W. Ball, Edward MercerPublisher:Cengage Learning
 Chemistry: Principles and ReactionsChemistryISBN:9781305079373Author:William L. Masterton, Cecile N. HurleyPublisher:Cengage Learning
 Chemistry & Chemical ReactivityChemistryISBN:9781337399074Author:John C. Kotz, Paul M. Treichel, John Townsend, David TreichelPublisher:Cengage Learning
 ChemistryChemistryISBN:9781305957404Author:Steven S. Zumdahl, Susan A. Zumdahl, Donald J. DeCostePublisher:Cengage Learning
 Chemistry: An Atoms First ApproachChemistryISBN:9781305079243Author:Steven S. Zumdahl, Susan A. ZumdahlPublisher:Cengage Learning