
Concept explainers
Videos
A group of business students at Tech organized a student club called Prism to Develop and disseminate content about business majors through a website they created. They would like the college and various academic departments to use their club website to provide information about, and promote, their majors, and to post possible job opportunities from potential employers. In order to convince the college administration and department heads to use their site, they want to develop a
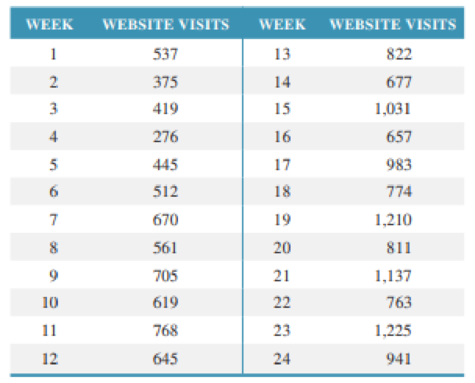
Develop a linear trend line forecast, an exponential smoothing forecast (α = .60) and a three-month weighted moving average (with the most recent month weighted by .50, the next closest month by .30 and the final month by .20). Indicate which one seems to be the most accurate forecast model and the forecast for week 25.
Want to see the full answer?
Check out a sample textbook solution
Chapter 12 Solutions
Operations and Supply Chain Management 9th edition
Additional Business Textbook Solutions
PRIN.OF CORPORATE FINANCE
Engineering Economy (17th Edition)
Horngren's Financial & Managerial Accounting, The Financial Chapters (Book & Access Card)
Business Essentials (12th Edition) (What's New in Intro to Business)
Marketing: An Introduction (13th Edition)
Principles of Operations Management: Sustainability and Supply Chain Management (10th Edition)


- How would you design and implement a modern networking solution for JAMS Manufacturing to connect all their facilities and ensure seamless communication? The company currently has standalone systems in three manufacturing plants and an office building, each using its own modem or router for internet access. The goal is to create private networks for each location, connect them to one another, and provide Internet access to all. You’ll need to consider factors like new computer systems, servers, and telecommunications wiring, and explain how your solution will benefit the company and how it will be implemented effectively.arrow_forwardIdentify specific performance management processes covered in this course and how each aligns with an elements of LaFevor’s HCMS Model.arrow_forwardIdentify specific performance management processes covered in this course and how each aligns with LaFevor’s HCMS Model. LaFevor, K. (2017). What’s in Your Human Capital Management Strategy? The Game Plan, the Path, and Achievingarrow_forward
- assess how Human Capital Management Strategy is aimed at building an effective integrated performance management system: Discuss how human capital management strategy relates to performance management.arrow_forwardCASE STUDY 9-1 Was Robert Eaton a Good Performance Management Leader? R obert Eaton was CEO and chairman of Chrys- ler from 1993 to 1998, replacing Lee Iacocca, who retired after serving in this capacity since 1978. Eaton then served as cochairman of the newly merged DaimlerChrysler organization from 1998 to 2000. In fact, Eaton was responsible for the sale of Chrysler Corporation to Daimler-Benz, thereby creating DaimlerChrysler. With 362,100 employees, DaimlerChrysler had achieved revenues of €136.4 billion in 2003. DaimlerChrysler's passenger car brands included Maybach, Mercedes-Benz, Chrysler, Jeep, Dodge, and Smart. Commercial vehicle brands included Mercedes-Benz, Freightliner, Sterling, Western Star, and Setra. From the beginning of his tenure as CEO, Eaton communicated with the people under him. He immediately shared his plans for the future with his top four executives, and upon the advice of his colleague, Bob Lutz, decided to look around the company before making any hasty…arrow_forwardCritically assess Martin’s coaching style.arrow_forward
- Compare Robert Eaton’s performance management leadership presented in the case against the performance management leadership principles, functions, and behaviors. What recommendations can be made about what he might do more effectively? Explain and defend your answer.arrow_forwardIn the context of the material in Chapter 9, provide a critical analysis of the decisions that Henry has made in assigning Martin to this role.arrow_forwardpanies (pp. 80-118). New York, NY: Times Books, specifically Chap. 4, "Robert Eaton and Robert Lutz; The Copilots." CASE STUDY 9-2 Performance Management Leadership at Henry's Commercial Sales and Leasing H enry is the owner of a small real estate agency that handles the sale and leasing of commercial property. He has two real estate agents working in the office, along with himself. He also has two customer service representatives (CSRs), each of whom has a real estate license, and one receptionist who has worked for the company for about three months. Henry has recently decided that he needs another customer service representative. He hasarrow_forward
- Discuss possible solutions to help Tara become an effective CSR. What should martin be doing to help her?arrow_forwardWhat are the ethical challenges regarding employees (i.e., diversity, discrimination, sexual harassment, privacy, employee theft, bad leadership, etc.) that Apple Inc. has faced over the past five to ten years and that they should prepare to face in the next five to ten years. Once a developed list of challenges is created, consider how having faced those challenges will impact and be impacted by the social cause you've selected. Propose the findings on the ethical challenges faced by Apple Inc. in recent history and the near future. Analyze ways in which each challenge was (and/or could be) appropriately handled and areas for improvement. Evaluate the ethical/moral aspects of Apple Inc. that protected it from ethical challenges in the past and could protect it in the future. Assess how ethical challenges and handling of ethical challenges could positively or negatively impact the charitable cause are selected and how the selection of your social cause could positively or negatively…arrow_forwardBy selecting Cigna Accredo pharmacy that i identify in my resand compare the current feedback system against the “Characteristics of a Good Multiple Source Feedback Systems” described in section 8-3-3. What can be improved? As a consultant, what recommendations would you make?arrow_forward
 Contemporary MarketingMarketingISBN:9780357033777Author:Louis E. Boone, David L. KurtzPublisher:Cengage Learning
 MarketingMarketingISBN:9780357033791Author:Pride, William MPublisher:South Western Educational Publishing
 Practical Management ScienceOperations ManagementISBN:9781337406659Author:WINSTON, Wayne L.Publisher:Cengage,
 Purchasing and Supply Chain ManagementOperations ManagementISBN:9781285869681Author:Robert M. Monczka, Robert B. Handfield, Larry C. Giunipero, James L. PattersonPublisher:Cengage Learning