Operations and Supply Chain Management 9th edition
9th Edition
ISBN: 9781119320975
Author: Roberta S. Russell, Bernard W. Taylor III
Publisher: WILEY
expand_more
expand_more
format_list_bulleted
Concept explainers
Videos
Textbook Question
Chapter 12, Problem 16P
The Great Northwest Outdoor Company is a catalog sales operation that specializes in outdoor recreational clothing. Demand for its items is very seasonal, peaking during the holiday season and during the spring. It has accumulated the following data for order per “season” (quarter) during the past five years:
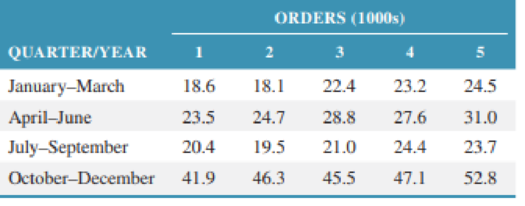
- a. Develop a seasonally adjusted
forecast model for these order data. Forecast demand for each quarter for year 6 (using a linear trend line forecast estimate for orders in year 6). - b. Develop a separate linear trend line forecast for each of the four seasons and forecast each season for year 6.
- c. Which of the two approaches used in parts (a) and (b) appear to be the most accurate? Use MAD to verify your selection.
Expert Solution & Answer
Want to see the full answer?
Check out a sample textbook solution
Students have asked these similar questions
Use the internet to obtain crash safety ratings for passenger vehicles. Then, answer thesequestions:a. Which vehicles received the highest ratings? The lowest ratings?b. How important are crash-safety ratings to new car buyers? Does the degree of importancedepend on the circumstances of the buyer?c. Which types of buyers would you expect to be the most concerned with crash-safety ratings?d. Are there other features of a new car that might sway a buyer from focusing solely on crashsafety? If so, what might they be?
“Implementing a Performance Management Communication Plan at Accounting, Inc.”
Evaluate Accounting Inc.’s communication plan. Specifically, does it answer all of the questions that a good communication plan should answer? Which questions are left unanswered? How would you provide answers to the unanswered questions? “Implementing an Appeals Process at Accounting, Inc.”
If you were to design an appeals process to handle these complaints well, what would be the appeal process? Describe the recommended process and why.
The annual demand for water bottles at Mega Stores is 500 units, with an ordering cost of Rs. 200
per order. If the annual inventory holding cost is estimated to be 20%. of unit cost, how frequently
should he replenish his stocks? Further, suppose the supplier offers him a discount on bulk
ordering as given below. Can the manager reduce his costs by taking advantage of either of these
discounts? Recommend the best ordering policy for the store.
Order size Unit cost (Rs.)
1 – 49 pcs. 20.00
50 – 149 pcs. 19.50
150 – 299 pcs. 19.00
300 pcs. or more 18.00
Chapter 12 Solutions
Operations and Supply Chain Management 9th edition
Ch. 12 - List some of the operations and functions in a...Ch. 12 - What is the difference between quantitative...Ch. 12 - Describe the difference between short- and...Ch. 12 - Prob. 4QCh. 12 - Why is accurate forecasting so important to...Ch. 12 - Discuss the relationship between forecasting and...Ch. 12 - Prob. 7QCh. 12 - Describe the Delphi method for forecasting.Ch. 12 - What is the difference between a trend and a cycle...Ch. 12 - How is the moving average method similar to...
Ch. 12 - In the chapter examples for time series methods,...Ch. 12 - What effect on the exponential smoothing model...Ch. 12 - How does adjusted exponential smoothing differ...Ch. 12 - What determines the choice of the smoothing...Ch. 12 - How does the linear trend line forecasting model...Ch. 12 - Of the time series models presented in this...Ch. 12 - What advantages does adjusted exponential...Ch. 12 - Describe how a forecast is monitored to detect...Ch. 12 - Explain the relationship between the use of a...Ch. 12 - Selecting from MAD, MAPD, MSE, E, and E, which...Ch. 12 - What is the difference between linear and multiple...Ch. 12 - Define the different components (y, x, a, and b)...Ch. 12 - A company that produces video equipment, including...Ch. 12 - The Hartley-Davis motorcycle dealer in the...Ch. 12 - The manager of the I-85 Carpet Outlet needs to be...Ch. 12 - The LawnPlus Fertilizer Company distributes...Ch. 12 - Graph the demand data in Problem 12.3. Can you...Ch. 12 - The chairperson of the department of management at...Ch. 12 - The manager of the Excom Service Station wants to...Ch. 12 - The Intrepid mutual fund of growth stocks has had...Ch. 12 - The Oceanside Hotel is adjacent to City Coliseum,...Ch. 12 - Mary Hernandez has invested in a stock mutual fund...Ch. 12 - Globetron manufactures components for use in small...Ch. 12 - The Bee Line Caf is well known for its popular...Ch. 12 - For the demand data in Problem 12.11, develop a...Ch. 12 - Develop a seasonally adjusted forecast for the...Ch. 12 - Backstreets Pizza delivery service has randomly...Ch. 12 - The Willow River Mining Company mines and ships...Ch. 12 - The Great Northwest Outdoor Company is a catalog...Ch. 12 - Townside Food Vending operates vending machines in...Ch. 12 - The town aquatic center has an indoor pool that...Ch. 12 - Develop an adjusted exponential smoothing forecast...Ch. 12 - During the past five months the emergency room at...Ch. 12 - At its craft store and through its website, the...Ch. 12 - A group of business students at Tech organized a...Ch. 12 - Temco Industries has developed a forecasting model...Ch. 12 - Monitor the forecast in Problem 12.23 for bias...Ch. 12 - Develop a statistical control chart for the...Ch. 12 - Monitor the adjusted exponential smoothing...Ch. 12 - Develop an exponential smoothing forecast with =...
Additional Business Textbook Solutions
Find more solutions based on key concepts
The flowchart for the process at the local car wash. Introduction: Flowchart: A flowchart is a visualrepresenta...
Principles of Operations Management: Sustainability and Supply Chain Management (10th Edition)
Identify and briefly describe the two general forecasting approaches.
Operations Management
1-1. Define marketing and outline the steps in the marketing process. (AASCB: Communication)
Marketing: An Introduction (13th Edition)
CHAPTER CASE
S&S Air’s Mortgage
Mark Sexton and Todd Story, the owners of S&S Air, Inc., were impressed by the ...
Essentials of Corporate Finance (Mcgraw-hill/Irwin Series in Finance, Insurance, and Real Estate)
15-18 Societal moral issue: Although enforcement of worker safety in Bangladesh is clearly lax, government offi...
Fundamentals of Management (10th Edition)
E2-13 Identifying increases and decreases in accounts and normal balances
Learning Objective 2
Insert the mis...
Horngren's Accounting (12th Edition)
Knowledge Booster


Learn more about
Need a deep-dive on the concept behind this application? Look no further. Learn more about this topic, operations-management and related others by exploring similar questions and additional content below.Similar questions
- Help answer showing level work and formulasarrow_forwardI need to forecast using a 3-Period-Moving-Average-Monthly forecasting model which I did but then I need to use my forecast numbers to generate a Master Production Schedule (MPS) I have to Start with actual sales (my own test data numbers) for August-2022 Oct-2022 i need to create MPS to supply demand starting November-2022 April 2023 I just added numbers without applying formulas to the mps on the right side of the spreadsheet because I do not know how to do it. The second image is the example of what it should look like. Thank You.arrow_forwardSolve the following Question 1. How do volume and variety affect the process selection and layout types? Discuss 2. How is the human resource aspect important to operation function? Discuss 3. Discuss the supply network design and its impact on the overall performance of the organization.arrow_forward
- The supply chain is a conventional notion, but organizations are only really interested in making products that they can sell to customers. Provided they have reliable supplies of materials and reasonable transport for finished products, logistics is irrelevant. Do you think this is true? If yes, explain, and if no, clearly explain as well.arrow_forwardworking as a program operations managerarrow_forward12 X1, X230 1 x =0x2 write the Following linear Programming model by 1- general Form Canonical Forms Canonical formY 2- Standard Form Max Z=35X+ 4 X 2 +6 X3 ST. X+2X2-5x3 = 40 3X, + 6X2 + 7x 3 = 30 7x, +lox2 x3 = 50 X3 X 2 X 3 <0arrow_forward
- a/ a Minimum cost assign each worker for one job at Jobs J1 12 33 WI 2 4 6 W2 5 W3 5 33 6 7arrow_forwardوبة واضافة هذه القيمة الى القيم Ex: Assign each job for each worker at minimum total Cost عمل لكل عامل وبأقل كلفة ممكنة obs الأعمال Workors العمال J1 J2 J3 J4 W₁ 15 13 14 12 W2 11 12 15 13 W3 13 12 10 11 W4 15 17 14 16arrow_forwardThe average completion time (flow time) for the sequence developed using the FCFS rule = 11.75 days (round your response to two decimal places). The percentage utilization for the sequence developed using the FCFS rule = 42.55 % (enter your response as a percentage rounded to two decimal places). b) Using the SPT (shortest processing time) decision rule for sequencing the jobs, the order is (to resolve a tie, use the order in which the jobs were received): An Alabama lumberyard has four jobs on order, as shown in the following table. Today is day 205 on the yard's schedule. In what sequence would the jobs be ranked according to the decision rules on the left: Job Due Date A 212 B 209 C 208 D 210 Duration (days) 6 3 3 8 Sequence 1 Job B 2 3 4 A D The average tardiness (job lateness) for the sequence developed using the SPT rule = 5.00 days (round your response to two decimal places). The average completion time (flow time) for the sequence developed using the SPT rule = 10.25 days…arrow_forward
arrow_back_ios
SEE MORE QUESTIONS
arrow_forward_ios
Recommended textbooks for you
 Contemporary MarketingMarketingISBN:9780357033777Author:Louis E. Boone, David L. KurtzPublisher:Cengage Learning
 MarketingMarketingISBN:9780357033791Author:Pride, William MPublisher:South Western Educational Publishing
 Purchasing and Supply Chain ManagementOperations ManagementISBN:9781285869681Author:Robert M. Monczka, Robert B. Handfield, Larry C. Giunipero, James L. PattersonPublisher:Cengage Learning
 Practical Management ScienceOperations ManagementISBN:9781337406659Author:WINSTON, Wayne L.Publisher:Cengage,
Contemporary Marketing
Marketing
ISBN:9780357033777
Author:Louis E. Boone, David L. Kurtz
Publisher:Cengage Learning
Marketing
Marketing
ISBN:9780357033791
Author:Pride, William M
Publisher:South Western Educational Publishing
Purchasing and Supply Chain Management
Operations Management
ISBN:9781285869681
Author:Robert M. Monczka, Robert B. Handfield, Larry C. Giunipero, James L. Patterson
Publisher:Cengage Learning
Practical Management Science
Operations Management
ISBN:9781337406659
Author:WINSTON, Wayne L.
Publisher:Cengage,
Single Exponential Smoothing & Weighted Moving Average Time Series Forecasting; Author: Matt Macarty;https://www.youtube.com/watch?v=IjETktmL4Kg;License: Standard YouTube License, CC-BY
Introduction to Forecasting - with Examples; Author: Dr. Bharatendra Rai;https://www.youtube.com/watch?v=98K7AG32qv8;License: Standard Youtube License