Concept explainers
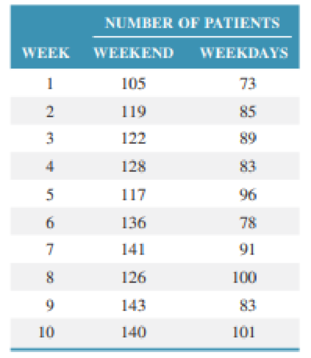
During the past five months the emergency room at the new County Hospital has observed the number of patients during two parts of every other week—the weekend (Friday through Sunday) and weekdays (Monday through Thursday). They typically experience greater patient traffic on weekends than during the week:

Develop a seasonally adjusted
Want to see the full answer?
Check out a sample textbook solution
Chapter 12 Solutions
Operations and Supply Chain Management 9th edition
Additional Business Textbook Solutions
Operations Management
Principles of Operations Management: Sustainability and Supply Chain Management (10th Edition)
Operations Management: Processes and Supply Chains (11th Edition)
Operations Management, Binder Ready Version: An Integrated Approach
Operations Management: Sustainability and Supply Chain Management (12th Edition)
Business in Action (8th Edition)
- Under what conditions might a firm use multiple forecasting methods?arrow_forwardA police station had to deploy a police officer for an emergency multiple times in the last four evenings. The table below shows the number of emergencies each evening. Weekday Number of calls each day Monday 9:48 Tuesday 3 Wednesday 8 Thursday 11 (Round your answer to 1 decimal place.) What would be their forecast for the emergencies on Friday using a two-day moving average approach? Forecast for Friday callsarrow_forwardWhat are the similarities and differences between ridge regression and forecasting?arrow_forward
- Additional Algo 15-12 Forecasting with Seasonality Demand history for the past three years is shown below, along with the seasonal indices for each quarter. Year Year 1 Year 2 Year 3 Quarter: 580338888888 Demand 796 748 493 437 723 758 Year 4, Q1 forecast 538 467 734 735 501 466 Seasonal Index 1.218 1.231 0.829 0.741 1.218 1.231 0.829 0.741 1.218 1.231 0.829 0.741 Use exponential smoothing with alpha (a) = 0.15 and an initial forecast of 616 along with seasonality to calculate the Year 4, Q1 forecast Note: Do not round intermediate calculations. Round your answer to the nearest whole number.arrow_forwardSales of Volkswagen's popular Beetle have grown steadily at auto dealerships in Nevada during the past 5 years (see table below). Using exponential smoothing with a smoothing constant (α) of 0.30 and a starting forecast of 420.00, the following sales forecast has been developed: Year Sales Forecasted Sales 1 460 420.00 2 510 432.00 3 520 455.40 Using smoothing constants of 0.60 and 0.90, develop forecasts for the sales of VW Beetles. Use MAD to determine which of the three smoothing constants (0.30, 0.60, or 0.90) gives the most accurate forecast. The MAD for a forecast developed using exponential smoothing with α=0.30 is nothing sales. (Round your response to two decimal places.)arrow_forwardHow do exponential smoothing advantages have over moving averages as a forecasting tool?arrow_forward
- The following gives the number of accidents that occurred on Florida State Highway 101 during the last 4 months: Month Number of Accidents Jan 30 Using least-squares regression, the forecast for the number of accidents that will occur in the month of May Feb 48 Using the least-squares regression method, the trend equation for forecasting is (round your responses to two decimal places): y = 9 + 19.20 x = Mar 60 Apr 90 accidents (enter your response as a whole number).arrow_forward4 Trinity General Hospital had the following number of patient admissions during the past 8 weeks Patient Week Admissions 1 120 145 3 95 4 112 5 130 6. 110 7 100 140 Develop a 3-weck weighted average forecast for Week 4 through 9 with weights a W1 = 0.2 W2 = 0.3 W3 = 0.5 Forecast patient admissions for week 9 using simple | exponential smoothing with a = 0.2. Assume that the forecast for Week 2 (F2) is the naïve forecast.arrow_forwardHow is exponential smoothing superior to moving averages as a forecasting tool?arrow_forward
- Explain different forecasting techniques like moving averages, exponential smoothing, regression etc.arrow_forwardWhen should time series forecasting techniques be used?arrow_forwardTwo forecasting models were used to predict the future value of a time series. These are shown in the accompanying table, together with the actual values. Forecast Value Ft Model 1 Model 2 Actual Yt 7.5 6.3 6 6.3 6.7 6.6 5.4 7.1 7.3 8.2 7.5 9.4 Compute MAD and MPE for each model and determine which was more accurate.arrow_forward
 Contemporary MarketingMarketingISBN:9780357033777Author:Louis E. Boone, David L. KurtzPublisher:Cengage LearningMarketingMarketingISBN:9780357033791Author:Pride, William MPublisher:South Western Educational Publishing
 Purchasing and Supply Chain ManagementOperations ManagementISBN:9781285869681Author:Robert M. Monczka, Robert B. Handfield, Larry C. Giunipero, James L. PattersonPublisher:Cengage Learning


