
Videos
a.
To construct: The appropriate graph that shows the relationship between two variables and interpret it. Also, explain the relationship between laundry practices and the choice of detergent
a.
Explanation of Solution
Given:
The table is:
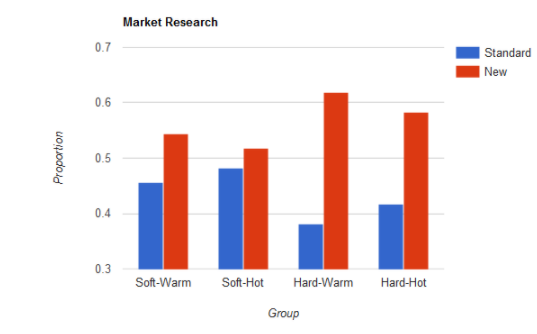
| Soft, warm | Soft, hot | Hard, warm | Hard, hot | |
| Standard | 0.4569 | 0.4821 | 0.3818 | 0.4167 |
| New | 0.5431 | 0.5179 | 0.6182 | 0.5833 |
Graph:
The figure could be constructed as:
Interpretation:
From the above figure, it is clear that most of the people in each category are preferring the new product and it is the highest in the “Hard-Warm” group and the lowest in the “Soft-Hot: group.
b.
To check: If the sample is providing sufficient evidence to conclude that the practices of laundry and preferences of product are independent or not.
b.
Explanation of Solution
Calculation:
The appropriate null and alternative hypotheses for the provided test could be written as:
The expected count is computed as:
| Soft, warm | Soft, hot | Hard, warm | Hard, hot | |
| Standard | 49.8079 | 24.0452 | 47.2316 | 30.9153 |
| New | 66.1921 | 31.9548 | 62.7684 | 41.0847 |
The test statistic is:
The degree of freedom is calculated as:
The p-value using chi-square table at 3 degree of freedom is 0.560
The p -value is above significance level. The null hypothesis does not get rejected. Thus, there is insufficient evidence to conclude that there is an association between two variables.
Chapter 11 Solutions
The Practice of Statistics for AP - 4th Edition
Additional Math Textbook Solutions
Thinking Mathematically (6th Edition)
Elementary Statistics: Picturing the World (7th Edition)
A Problem Solving Approach To Mathematics For Elementary School Teachers (13th Edition)
Elementary Statistics
Calculus: Early Transcendentals (2nd Edition)
Basic Business Statistics, Student Value Edition


- I need help with this problem and an explanation of the solution for the image described below. (Statistics: Engineering Probabilities)arrow_forwardI need help with this problem and an explanation of the solution for the image described below. (Statistics: Engineering Probabilities)arrow_forward310015 K Question 9, 5.2.28-T Part 1 of 4 HW Score: 85.96%, 49 of 57 points Points: 1 Save of 6 Based on a poll, among adults who regret getting tattoos, 28% say that they were too young when they got their tattoos. Assume that six adults who regret getting tattoos are randomly selected, and find the indicated probability. Complete parts (a) through (d) below. a. Find the probability that none of the selected adults say that they were too young to get tattoos. 0.0520 (Round to four decimal places as needed.) Clear all Final check Feb 7 12:47 US Oarrow_forward
- how could the bar graph have been organized differently to make it easier to compare opinion changes within political partiesarrow_forwardDraw a picture of a normal distribution with mean 70 and standard deviation 5.arrow_forwardWhat do you guess are the standard deviations of the two distributions in the previous example problem?arrow_forward
- Please answer the questionsarrow_forward30. An individual who has automobile insurance from a certain company is randomly selected. Let Y be the num- ber of moving violations for which the individual was cited during the last 3 years. The pmf of Y isy | 1 2 4 8 16p(y) | .05 .10 .35 .40 .10 a.Compute E(Y).b. Suppose an individual with Y violations incurs a surcharge of $100Y^2. Calculate the expected amount of the surcharge.arrow_forward24. An insurance company offers its policyholders a num- ber of different premium payment options. For a ran- domly selected policyholder, let X = the number of months between successive payments. The cdf of X is as follows: F(x)=0.00 : x < 10.30 : 1≤x<30.40 : 3≤ x < 40.45 : 4≤ x <60.60 : 6≤ x < 121.00 : 12≤ x a. What is the pmf of X?b. Using just the cdf, compute P(3≤ X ≤6) and P(4≤ X).arrow_forward
- 59. At a certain gas station, 40% of the customers use regular gas (A1), 35% use plus gas (A2), and 25% use premium (A3). Of those customers using regular gas, only 30% fill their tanks (event B). Of those customers using plus, 60% fill their tanks, whereas of those using premium, 50% fill their tanks.a. What is the probability that the next customer will request plus gas and fill the tank (A2 B)?b. What is the probability that the next customer fills the tank?c. If the next customer fills the tank, what is the probability that regular gas is requested? Plus? Premium?arrow_forward38. Possible values of X, the number of components in a system submitted for repair that must be replaced, are 1, 2, 3, and 4 with corresponding probabilities .15, .35, .35, and .15, respectively. a. Calculate E(X) and then E(5 - X).b. Would the repair facility be better off charging a flat fee of $75 or else the amount $[150/(5 - X)]? [Note: It is not generally true that E(c/Y) = c/E(Y).]arrow_forward74. The proportions of blood phenotypes in the U.S. popula- tion are as follows:A B AB O .40 .11 .04 .45 Assuming that the phenotypes of two randomly selected individuals are independent of one another, what is the probability that both phenotypes are O? What is the probability that the phenotypes of two randomly selected individuals match?arrow_forward
 MATLAB: An Introduction with ApplicationsStatisticsISBN:9781119256830Author:Amos GilatPublisher:John Wiley & Sons Inc
 Probability and Statistics for Engineering and th...StatisticsISBN:9781305251809Author:Jay L. DevorePublisher:Cengage Learning
 Statistics for The Behavioral Sciences (MindTap C...StatisticsISBN:9781305504912Author:Frederick J Gravetter, Larry B. WallnauPublisher:Cengage Learning
 Elementary Statistics: Picturing the World (7th E...StatisticsISBN:9780134683416Author:Ron Larson, Betsy FarberPublisher:PEARSON
 The Basic Practice of StatisticsStatisticsISBN:9781319042578Author:David S. Moore, William I. Notz, Michael A. FlignerPublisher:W. H. Freeman
 Introduction to the Practice of StatisticsStatisticsISBN:9781319013387Author:David S. Moore, George P. McCabe, Bruce A. CraigPublisher:W. H. Freeman