
Videos
(a)
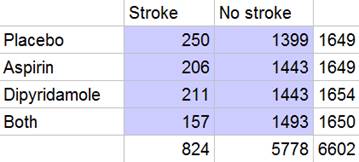
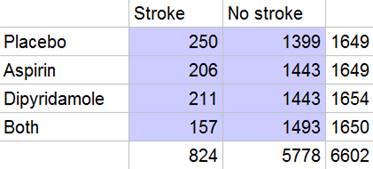
To summarize these data in a two-way table.
(a)
Explanation of Solution
In the question, it is given that aspirin prevents blood from clotting and so help prevent strokes. Thus, the data on the strokes for the two-year study is given in the question. Thus, the summary of these data in a two-way table can be represented by the number of no strokes is the number of patients decreased by the number of strokes, that is,
(b)
To make a graph to compare the success rates for the four treatments and describe what you see.
(b)
Explanation of Solution
In the question, it is given that aspirin prevents blood from clotting and so help prevent strokes. Thus, the data on the strokes for the two-year study is given in the question. Thus, the summary of these data in a two-way table can be represented by the number of no strokes is the number of patients decreased by the number of strokes, that is,
So therefore the proportion in each group is the number of strokes/ no strokes divided by the row total given in the last column is calculated as:
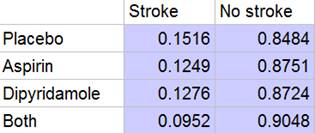
Thus, the graph to compare the success rates for the four treatments can be constructed as:
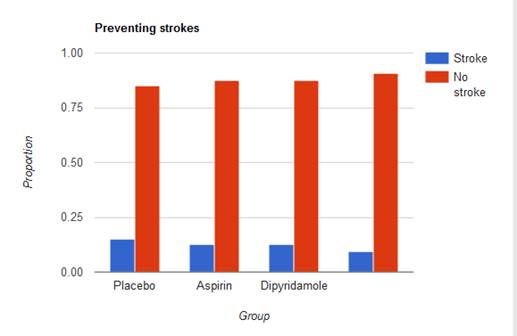
Thus, by looking at the histogram we note that the proportions of strokes/no strokes do not seems to vary much by group.
(c)
To explain in words what the null hypothesis
(c)
Answer to Problem 38E
It says proportion of successes for each treatment is the same.
Explanation of Solution
In the question, it is given that aspirin prevents blood from clotting and so help prevent strokes. Thus, the data on the strokes for the two-year study is given in the question. Thus, the summary of these data in a two-way table can be represented by the number of no strokes is the number of patients decreased by the number of strokes, that is,
Thus, it is given the null hypothesis in the question as:
And the null hypothesis says about the subjects’ smoking habits that this means that the proportion of successes for each treatment is the same.
(d)
To find the expected counts if null hypothesis is true and display them in a two-way table of observed counts.
(d)
Explanation of Solution
In the question, it is given that aspirin prevents blood from clotting and so help prevent strokes. Thus, the data on the strokes for the two-year study is given in the question. Thus, the summary of these data in a two-way table can be represented by the number of no strokes is the number of patients decreased by the number of strokes, that is,
Thus, it is given the null hypothesis in the question as:
Thus, the expected counts are the row total multiplied by the column total, divided by the
Chapter 11 Solutions
The Practice of Statistics for AP - 4th Edition
Additional Math Textbook Solutions
A Problem Solving Approach To Mathematics For Elementary School Teachers (13th Edition)
Elementary Statistics: Picturing the World (7th Edition)
Calculus: Early Transcendentals (2nd Edition)
Introductory Statistics
Elementary Statistics (13th Edition)
Intro Stats, Books a la Carte Edition (5th Edition)


- Please answer the questionsarrow_forward30. An individual who has automobile insurance from a certain company is randomly selected. Let Y be the num- ber of moving violations for which the individual was cited during the last 3 years. The pmf of Y isy | 1 2 4 8 16p(y) | .05 .10 .35 .40 .10 a.Compute E(Y).b. Suppose an individual with Y violations incurs a surcharge of $100Y^2. Calculate the expected amount of the surcharge.arrow_forward24. An insurance company offers its policyholders a num- ber of different premium payment options. For a ran- domly selected policyholder, let X = the number of months between successive payments. The cdf of X is as follows: F(x)=0.00 : x < 10.30 : 1≤x<30.40 : 3≤ x < 40.45 : 4≤ x <60.60 : 6≤ x < 121.00 : 12≤ x a. What is the pmf of X?b. Using just the cdf, compute P(3≤ X ≤6) and P(4≤ X).arrow_forward
- 59. At a certain gas station, 40% of the customers use regular gas (A1), 35% use plus gas (A2), and 25% use premium (A3). Of those customers using regular gas, only 30% fill their tanks (event B). Of those customers using plus, 60% fill their tanks, whereas of those using premium, 50% fill their tanks.a. What is the probability that the next customer will request plus gas and fill the tank (A2 B)?b. What is the probability that the next customer fills the tank?c. If the next customer fills the tank, what is the probability that regular gas is requested? Plus? Premium?arrow_forward38. Possible values of X, the number of components in a system submitted for repair that must be replaced, are 1, 2, 3, and 4 with corresponding probabilities .15, .35, .35, and .15, respectively. a. Calculate E(X) and then E(5 - X).b. Would the repair facility be better off charging a flat fee of $75 or else the amount $[150/(5 - X)]? [Note: It is not generally true that E(c/Y) = c/E(Y).]arrow_forward74. The proportions of blood phenotypes in the U.S. popula- tion are as follows:A B AB O .40 .11 .04 .45 Assuming that the phenotypes of two randomly selected individuals are independent of one another, what is the probability that both phenotypes are O? What is the probability that the phenotypes of two randomly selected individuals match?arrow_forward
- 53. A certain shop repairs both audio and video compo- nents. Let A denote the event that the next component brought in for repair is an audio component, and let B be the event that the next component is a compact disc player (so the event B is contained in A). Suppose that P(A) = .6 and P(B) = .05. What is P(BA)?arrow_forward26. A certain system can experience three different types of defects. Let A;(i = 1,2,3) denote the event that the sys- tem has a defect of type i. Suppose thatP(A1) = .12 P(A) = .07 P(A) = .05P(A, U A2) = .13P(A, U A3) = .14P(A2 U A3) = .10P(A, A2 A3) = .011Rshelfa. What is the probability that the system does not havea type 1 defect?b. What is the probability that the system has both type 1 and type 2 defects?c. What is the probability that the system has both type 1 and type 2 defects but not a type 3 defect? d. What is the probability that the system has at most two of these defects?arrow_forwardThe following are suggested designs for group sequential studies. Using PROCSEQDESIGN, provide the following for the design O’Brien Fleming and Pocock.• The critical boundary values for each analysis of the data• The expected sample sizes at each interim analysisAssume the standardized Z score method for calculating boundaries.Investigators are evaluating the success rate of a novel drug for treating a certain type ofbacterial wound infection. Since no existing treatment exists, they have planned a one-armstudy. They wish to test whether the success rate of the drug is better than 50%, whichthey have defined as the null success rate. Preliminary testing has estimated the successrate of the drug at 55%. The investigators are eager to get the drug into production andwould like to plan for 9 interim analyses (10 analyzes in total) of the data. Assume thesignificance level is 5% and power is 90%.Besides, draw a combined boundary plot (OBF, POC, and HP)arrow_forward
- Please provide the solution for the attached image in detailed.arrow_forward20 km, because GISS Worksheet 10 Jesse runs a small business selling and delivering mealie meal to the spaza shops. He charges a fixed rate of R80, 00 for delivery and then R15, 50 for each packet of mealle meal he delivers. The table below helps him to calculate what to charge his customers. 10 20 30 40 50 Packets of mealie meal (m) Total costs in Rands 80 235 390 545 700 855 (c) 10.1. Define the following terms: 10.1.1. Independent Variables 10.1.2. Dependent Variables 10.2. 10.3. 10.4. 10.5. Determine the independent and dependent variables. Are the variables in this scenario discrete or continuous values? Explain What shape do you expect the graph to be? Why? Draw a graph on the graph provided to represent the information in the table above. TOTAL COST OF PACKETS OF MEALIE MEAL 900 800 700 600 COST (R) 500 400 300 200 100 0 10 20 30 40 60 NUMBER OF PACKETS OF MEALIE MEALarrow_forwardLet X be a random variable with support SX = {−3, 0.5, 3, −2.5, 3.5}. Part ofits probability mass function (PMF) is given bypX(−3) = 0.15, pX(−2.5) = 0.3, pX(3) = 0.2, pX(3.5) = 0.15.(a) Find pX(0.5).(b) Find the cumulative distribution function (CDF), FX(x), of X.1(c) Sketch the graph of FX(x).arrow_forward
 MATLAB: An Introduction with ApplicationsStatisticsISBN:9781119256830Author:Amos GilatPublisher:John Wiley & Sons Inc
 Probability and Statistics for Engineering and th...StatisticsISBN:9781305251809Author:Jay L. DevorePublisher:Cengage Learning
 Statistics for The Behavioral Sciences (MindTap C...StatisticsISBN:9781305504912Author:Frederick J Gravetter, Larry B. WallnauPublisher:Cengage Learning
 Elementary Statistics: Picturing the World (7th E...StatisticsISBN:9780134683416Author:Ron Larson, Betsy FarberPublisher:PEARSON
 The Basic Practice of StatisticsStatisticsISBN:9781319042578Author:David S. Moore, William I. Notz, Michael A. FlignerPublisher:W. H. Freeman
 Introduction to the Practice of StatisticsStatisticsISBN:9781319013387Author:David S. Moore, George P. McCabe, Bruce A. CraigPublisher:W. H. Freeman