
Concept explainers
Videos
(a)
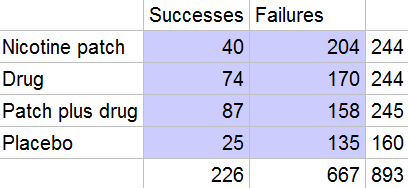
To summarize these data in a two-way table.
(a)
Explanation of Solution
In the question, it is given different ways so that a person can quit smoking and the table with different ways and with their success. Thus, the summary of these data in a two-way table can be represented as:
(b)
To make a graph to compare the success rates for the four treatments and describe what you see.
(b)
Explanation of Solution
In the question, it is given different ways so that a person can quit smoking and the table with different ways and with their success. And the proportion in each group is the number of successes/failures divided by the row total given in the last column is as:
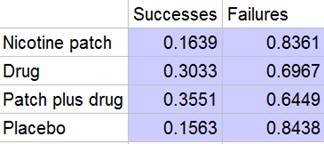
Thus, the graph to compare the success rates for the four treatments can be constructed as:

Thus, by looking at the histogram we can say that there appears to be no different in proportion between Nicotine Patch and Placebo. And the group Drug or Both seem to have a better success rate.
(c)
To explain in words what the null hypothesis
(c)
Answer to Problem 37E
It says proportion of successes for each treatment is the same.
Explanation of Solution
In the question, it is given different ways so that a person can quit smoking and the table with different ways and with their success. Thus, it is given the null hypothesis in the question as:
And the null hypothesis says about the subjects’ smoking habits that this means that the proportion of successes for each treatment is the same.
(d)
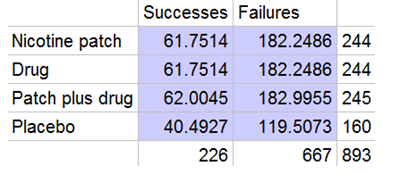
To find the expected counts if null hypothesis is true and display them in a two-way table of observed counts.
(d)
Explanation of Solution
In the question, it is given different ways so that a person can quit smoking and the table with different ways and with their success. Thus, it is given the null hypothesis in the question as:
And the summary of these data in a two-way table can be represented as:

Thus, the expected counts are the row total multiplied by the column total, divided by the
Chapter 11 Solutions
The Practice of Statistics for AP - 4th Edition
Additional Math Textbook Solutions
Calculus for Business, Economics, Life Sciences, and Social Sciences (14th Edition)
A Problem Solving Approach To Mathematics For Elementary School Teachers (13th Edition)
Algebra and Trigonometry (6th Edition)
A First Course in Probability (10th Edition)


- 3. Explain why the following statements are not correct. a. "With my methodological approach, I can reduce the Type I error with the given sample information without changing the Type II error." b. "I have already decided how much of the Type I error I am going to allow. A bigger sample will not change either the Type I or Type II error." C. "I can reduce the Type II error by making it difficult to reject the null hypothesis." d. "By making it easy to reject the null hypothesis, I am reducing the Type I error."arrow_forwardGiven the following sample data values: 7, 12, 15, 9, 15, 13, 12, 10, 18,12 Find the following: a) Σ x= b) x² = c) x = n d) Median = e) Midrange x = (Enter a whole number) (Enter a whole number) (use one decimal place accuracy) (use one decimal place accuracy) (use one decimal place accuracy) f) the range= g) the variance, s² (Enter a whole number) f) Standard Deviation, s = (use one decimal place accuracy) Use the formula s² ·Σx² -(x)² n(n-1) nΣ x²-(x)² 2 Use the formula s = n(n-1) (use one decimal place accuracy)arrow_forwardTable of hours of television watched per week: 11 15 24 34 36 22 20 30 12 32 24 36 42 36 42 26 37 39 48 35 26 29 27 81276 40 54 47 KARKE 31 35 42 75 35 46 36 42 65 28 54 65 28 23 28 23669 34 43 35 36 16 19 19 28212 Using the data above, construct a frequency table according the following classes: Number of Hours Frequency Relative Frequency 10-19 20-29 |30-39 40-49 50-59 60-69 70-79 80-89 From the frequency table above, find a) the lower class limits b) the upper class limits c) the class width d) the class boundaries Statistics 300 Frequency Tables and Pictures of Data, page 2 Using your frequency table, construct a frequency and a relative frequency histogram labeling both axes.arrow_forward
- Table of hours of television watched per week: 11 15 24 34 36 22 20 30 12 32 24 36 42 36 42 26 37 39 48 35 26 29 27 81276 40 54 47 KARKE 31 35 42 75 35 46 36 42 65 28 54 65 28 23 28 23669 34 43 35 36 16 19 19 28212 Using the data above, construct a frequency table according the following classes: Number of Hours Frequency Relative Frequency 10-19 20-29 |30-39 40-49 50-59 60-69 70-79 80-89 From the frequency table above, find a) the lower class limits b) the upper class limits c) the class width d) the class boundaries Statistics 300 Frequency Tables and Pictures of Data, page 2 Using your frequency table, construct a frequency and a relative frequency histogram labeling both axes.arrow_forwardA study was undertaken to compare respiratory responses of hypnotized and unhypnotized subjects. The following data represent total ventilation measured in liters of air per minute per square meter of body area for two independent (and randomly chosen) samples. Analyze these data using the appropriate non-parametric hypothesis test. Unhypnotized: 5.0 5.3 5.3 5.4 5.9 6.2 6.6 6.7 Hypnotized: 5.8 5.9 6.2 6.6 6.7 6.1 7.3 7.4arrow_forwardThe class will include a data exercise where students will be introduced to publicly available data sources. Students will gain experience in manipulating data from the web and applying it to understanding the economic and demographic conditions of regions in the U.S. Regions and topics of focus will be determined (by the student with instructor approval) prior to April. What data exercise can I do to fulfill this requirement? Please explain.arrow_forward
- Consider the ceocomp dataset of compensation information for the CEO’s of 100 U.S. companies. We wish to fit aregression model to assess the relationship between CEO compensation in thousands of dollars (includes salary andbonus, but not stock gains) and the following variates:AGE: The CEOs age, in yearsEDUCATN: The CEO’s education level (1 = no college degree; 2 = college/undergrad. degree; 3 = grad. degree)BACKGRD: Background type(1= banking/financial; 2 = sales/marketing; 3 = technical; 4 = legal; 5 = other)TENURE: Number of years employed by the firmEXPER: Number of years as the firm CEOSALES: Sales revenues, in millions of dollarsVAL: Market value of the CEO's stock, in natural logarithm unitsPCNTOWN: Percentage of firm's market value owned by the CEOPROF: Profits of the firm, before taxes, in millions of dollars1) Create a scatterplot matrix for this dataset. Briefly comment on the observed relationships between compensationand the other variates.Note that companies with negative…arrow_forward6 (Model Selection, Estimation and Prediction of GARCH) Consider the daily returns rt of General Electric Company stock (ticker: "GE") from "2021-01-01" to "2024-03-31", comprising a total of 813 daily returns. Using the "fGarch" package of R, outputs of fitting three GARCH models to the returns are given at the end of this question. Model 1 ARCH (1) with standard normal innovations; Model 2 Model 3 GARCH (1, 1) with Student-t innovations; GARCH (2, 2) with Student-t innovations; Based on the outputs, answer the following questions. (a) What can be inferred from the Standardized Residual Tests conducted on Model 1? (b) Which model do you recommend for prediction between Model 2 and Model 3? Why? (c) Write down the fitted model for the model that you recommended in Part (b). (d) Using the model recommended in Part (b), predict the conditional volatility in the next trading day, specifically trading day 814.arrow_forward4 (MLE of ARCH) Suppose rt follows ARCH(2) with E(rt) = 0, rt = ut, ut = στει, σε where {+} is a sequence of independent and identically distributed (iid) standard normal random variables. With observations r₁,...,, write down the log-likelihood function for the model esti- mation.arrow_forward
- 5 (Moments of GARCH) For the GARCH(2,2) model rt = 0.2+0.25u1+0.05u-2 +0.30% / -1 +0.20% -2, find cov(rt). 0.0035 ut, ut = στει,στ =arrow_forwardDefinition of null hypothesis from the textbook Definition of alternative hypothesis from the textbook Imagine this: you suspect your beloved Chicken McNugget is shrinking. Inflation is hitting everything else, so why not the humble nugget too, right? But your sibling thinks you’re just being dramatic—maybe you’re just extra hungry today. Determined to prove them wrong, you take matters (and nuggets) into your own hands. You march into McDonald’s, get two 20-piece boxes, and head home like a scientist on a mission. Now, before you start weighing each nugget like they’re precious gold nuggets, let’s talk hypotheses. The average weight of nuggets as mentioned on the box is 16 g each. Develop your null and alternative hypotheses separately. Next, you weigh each nugget with the precision of a jeweler and find they average out to 15.5 grams. You also conduct a statistical analysis, and the p-value turns out to be 0.01. Based on this information, answer the following questions. (Remember,…arrow_forwardBusiness Discussarrow_forward
 MATLAB: An Introduction with ApplicationsStatisticsISBN:9781119256830Author:Amos GilatPublisher:John Wiley & Sons Inc
 Probability and Statistics for Engineering and th...StatisticsISBN:9781305251809Author:Jay L. DevorePublisher:Cengage Learning
 Statistics for The Behavioral Sciences (MindTap C...StatisticsISBN:9781305504912Author:Frederick J Gravetter, Larry B. WallnauPublisher:Cengage Learning
 Elementary Statistics: Picturing the World (7th E...StatisticsISBN:9780134683416Author:Ron Larson, Betsy FarberPublisher:PEARSON
 The Basic Practice of StatisticsStatisticsISBN:9781319042578Author:David S. Moore, William I. Notz, Michael A. FlignerPublisher:W. H. Freeman
 Introduction to the Practice of StatisticsStatisticsISBN:9781319013387Author:David S. Moore, George P. McCabe, Bruce A. CraigPublisher:W. H. Freeman