Interpretation:
The percentage of a and β phase in the phase diagram needs to be determined.
Concept introduction:
Alloy is a combination of two or more metals with another element or metal to form a new metal. The formed metal by combining two metals has different properties from pure metal like increased hardness, toughness, surface roughness;etc.an alloy may be a solid solution or combination of metallic phase. Alloys are having different metallic bonding character.
Answer to Problem 11.27P
At,
At,
At,
At,
At,
Explanation of Solution
Given:
5 percent weight of Si alloy at temperature
Calculation:
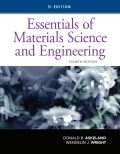
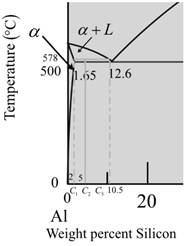
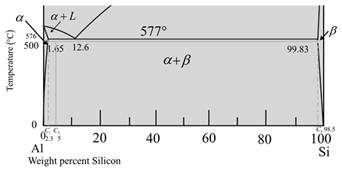
The given phase diagram is as follows:
The given diagram is a graph of plotted against temperature and weight percent of silicon.
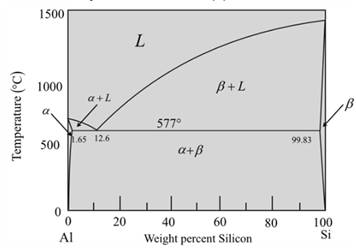
So, to calculate percent of a-phase and liquidphase first,
Draw a vertical linefrom alloy composition Al-5wt%Si
At temperature
Now for liquid phase,
From the given diagram is a graph plotted verses temperature weight percentage of silicon.
For temperature
The percentage of liquid phase is calculated as,
Where,
Put,
Now for a-phase,
So, percentage of phase at temperature
Percent of phase at calculate percent of as,
Where,
Put,
Therefore, weight percentage is,
So, the percentage of phase at
Now for liquid phase,
The diagram is a graph plotted against temperature and weight percent of silicon.
Calculate the percent of liquid phase by the formula,
Where,
Put,
Therefore, weight percentage is,
Now, calculate the percent for a-phase,
Where,
Put,
Therefore, at
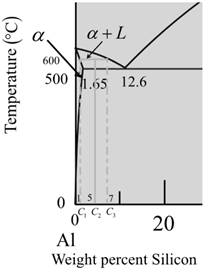
Now for temperature at
The given diagram is a graph plotted against temperature and weight percent of silicon.
Calculate the percentage of liquid phase as,
Where,
Put,
Now, calculate the percentage of a-phase.
Where,
Put,
Therefore, at
Now for temperature
The given diagram is a graph plotted against temperature and weight percent of silicon.
Now calculate the percentage of phase
Therefore, the percentage of β-phase,
Where,
Put,
Calculate the percentage of a- phase.
Where,
Put,
Therefore, at
Now for temperature
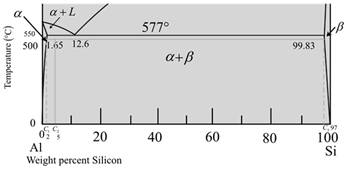
The given diagram is a graph plotted against temperature and weight percent of silicon.
Now calculate the percentage of phase
Therefore, the percentage of β-phase,
Where,
Put,
Calculate the percentage of a- phase.
Where,
Put,
Therefore, at
At,
At,
At,
At,
At,
Want to see more full solutions like this?
Chapter 11 Solutions
Essentials of Materials Science and Engineering, SI Edition

- This is an exam review question. The answer is Pmin = 622.9 lb but whyarrow_forwardPlease do not use any AI tools to solve this question. I need a fully manual, step-by-step solution with clear explanations, as if it were done by a human tutor. No AI-generated responses, please.arrow_forwardPlease do not use any AI tools to solve this question. I need a fully manual, step-by-step solution with clear explanations, as if it were done by a human tutor. No AI-generated responses, please.arrow_forward
- Please do not use any AI tools to solve this question. I need a fully manual, step-by-step solution with clear explanations, as if it were done by a human tutor. No AI-generated responses, please.arrow_forwardPlease, I want the solution in two ways: Method 1 (without the Smith chart): Method 2 (using the Smith chart): A short circuit stub of length 0.04λ is used to match a 50 Ω lossless line to a load ZL = RL + j30 Ω. Use Smith chart to find:(a) The distance between the stub and the load.(b) The value of RL .arrow_forwardTHE FIRST PAGE OF THIS QUESTION SECTION BELOW IS THE FIRST IMAGE UPLOADED, WHICH SHOWS A digital synchronous sequential circuit and then comes the questions below:1B) Suppose the flip-flops are 74F74 devices and the AND gates are 74F08 devices. Let maxtpd,D=9ns, maxtsu,D=3ns, and maxtpd,AND=6ns. What is the maximum clock frequency at which the circuit can operate reliably? 2) Compare serial transmission and parallel transmission and discuss their advantages and disadvantages. 3) Explain briefly how the slave can protect itself from being overwhelmed by the master in I2 4) A hypothetical logic family has the following specifications. VOH=4.6V VIH=4.0V VOL=0.5V VIL=1.0V IOH=-1mA IIH=50μA IOL=8mA IIL=-0.6mA (4a) What are the noise margins? (4b) What is the fan-out capability?…arrow_forward
- THE FIRST PAGE OF THIS QUESTION SECTION BELOW IS THE FIRST IMAGE UPLOADED, WHICH SHOWS A digital synchronous sequential circuit and then comes the questions below:1B) Suppose the flip-flops are 74F74 devices and the AND gates are 74F08 devices. Let maxtpd,D=9ns, maxtsu,D=3ns, and maxtpd,AND=6ns. What is the maximum clock frequency at which the circuit can operate reliably? 2) Compare serial transmission and parallel transmission and discuss their advantages and disadvantages. 3) Explain briefly how the slave can protect itself from being overwhelmed by the master in I2 4) A hypothetical logic family has the following specifications. VOH=4.6V VIH=4.0V VOL=0.5V VIL=1.0V IOH=-1mA IIH=50μA IOL=8mA IIL=-0.6mA (4a) What are the noise margins? (4b) What is the fan-out capability?…arrow_forwardThis is an old practice exam. Fce = 110lb and FBCD = 62 lb but whyarrow_forwardI need help on this question a) Find y(t) =yh(t) +yp(t) in time domainIs the system over-damped, under-damped, or critical?arrow_forward
- Given f(t)=a sin(ßt) a = 10 & ß = 23 Find the Laplace Transform using the definition F(s) = ∫f(t)e-stdtarrow_forward= Calculate Avf, Zif, and Zof for the amplifier circuit,Assume he = 50, hie 1.1k2, and identical transistors? 150kQ Vs 5002 HH +25v 10k +6 · 47ΚΩ 47k2 4.7k0} 33 ΚΩ 4.7ΚΩ 10k w 4.7kQ HH Voarrow_forwardI help understanding this question d'y + 4dy +3y = a, Initial Conditions: y(0) = 5 & y'(0)=0 Where a = 10 a) Find y(t) =yh(t) +yp(t) in time domainIs the system over-damped, under-damped, or critical? b) Find y(t) using Laplace Transformsarrow_forward
 MATLAB: An Introduction with ApplicationsEngineeringISBN:9781119256830Author:Amos GilatPublisher:John Wiley & Sons Inc
 Essentials Of Materials Science And EngineeringEngineeringISBN:9781337385497Author:WRIGHT, Wendelin J.Publisher:Cengage,
 Industrial Motor ControlEngineeringISBN:9781133691808Author:Stephen HermanPublisher:Cengage Learning
 Basics Of Engineering EconomyEngineeringISBN:9780073376356Author:Leland Blank, Anthony TarquinPublisher:MCGRAW-HILL HIGHER EDUCATION
 Structural Steel Design (6th Edition)EngineeringISBN:9780134589657Author:Jack C. McCormac, Stephen F. CsernakPublisher:PEARSON
 Fundamentals of Materials Science and Engineering...EngineeringISBN:9781119175483Author:William D. Callister Jr., David G. RethwischPublisher:WILEY