
Concept explainers
Videos
Compute the errors of bias and absolute deviation for the forecasts in problem 6 which of the
To compute: The errors of bias and absolute deviation and explain which forecast is the best.
Introduction:
Exponential smoothing:
In exponential smoothing forecast method, older data are given lesser importance, and newer data are given more importance. It is efficient in making short-term forecasts.
Explanation of Solution
Given information:
Forecast for period 1 (F1) = 90
Smoothing constant (α) = 0.1
| Period | Dt |
| 1 | 92 |
| 2 | 127 |
| 3 | 106 |
| 4 | 165 |
| 5 | 125 |
| 6 | 111 |
| 7 | 178 |
| 8 | 97 |
Formula for exponential smoothing:
Calculation of forecast:
The forecast for period 1 is 90.
Period 2:
The forecast for period 2 is 90.2.
Period 3:
The forecast for period 3 is 93.9.
Period 4:
The forecast for period 4 is 95.1.
Period 5:
The forecast for period 5 is 102.1.
Period 6:
The forecast for period 6 is 104.4.
Period 7:
The forecast for period 7 is 105.
Period 8:
The forecast for period 8 is 112.3.
Given information:
Forecast for period 1 (F1) = 90
Smoothing constant (α) = 0.3
| Period | Dt |
| 1 | 92 |
| 2 | 127 |
| 3 | 106 |
| 4 | 165 |
| 5 | 125 |
| 6 | 111 |
| 7 | 178 |
| 8 | 97 |
Calculation of forecast:
The forecast for period 1 is 90.
Period 2:
The forecast for period 2 is 90.6.
Period 3:
The forecast for period 3 is 101.5.
Period 4:
The forecast for period 4 is 102.9.
Period 5:
The forecast for period 5 is 121.5.
Period 6:
The forecast for period 6 is 122.6.
Period 7:
The forecast for period 7 is 119.1.
Period 8:
The forecast for period 8 is 136.8.
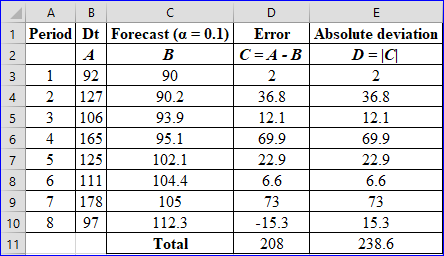
Calculation of error and absolute deviation:
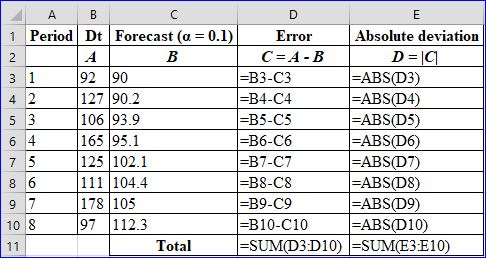
For α = 0.1
Excel work:
Excel formula:
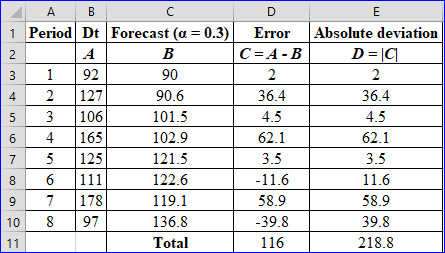
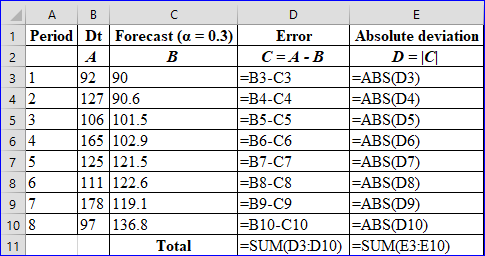
For α = 0.3
Excel work:
Excel formula:
For α = 0.1
Sum of error = 208
Sum of absolute deviation = 238.6
For α = 0.3
Sum of error = 116
Sum of absolute deviation = 218.8
The sum of error and absolute deviation is lower for α = 0.3 when compared with values of α = 0.1 (116 < 208) and (218.8 < 238.6). Hence, the forecasting method with α = 0.3 will be the best method.
The forecasting method with α = 0.3 is the best method.
Want to see more full solutions like this?
Chapter 10 Solutions
OPERATIONS MANAGEMENT IN THE SUPPLY CHAIN: DECISIONS & CASES (Mcgraw-hill Series Operations and Decision Sciences)


- Define the concept of a compensation philosophy, including the components that should be addressed in a compensation philosophy. Assess why a compensation philosophy is so foreign to most organizations and how you can best encourage an organization to create its own compensation philosophy that is beneficial to attracting the best talent.arrow_forward1) View the videos Taco Bell test-drives Live Mas restaurant concept in South Bay (0.32 mins, Ctrl+Click on the link) https://www.youtube.com/watch?v=04wRc5Wg8GU , and First-ever Taco Bell Live Mas Café serving exclusive drinks in Chula Vista (1.56 mins, Ctrl+Click on the link) https://www.youtube.com/watch?v=fq6jDxJk1LM , and answer the following questions: a) What is driving Taco Bell to try a beverage-focused format? b) What type of a process strategy does their beverage-focused format represent? c) What operational issues do you think Taco Bell would face from their beverage-focused format? d) What do you think are the main advantages and disadvantages of kiosk ordering? Note: As a rough guideline, please try to keep the written submission to one or two paragraphs for each of the questions. 2) Taipei Pharmaceuticals is planning to open a new manufacturing facility as part of its expansion plans. The firm has narrowed down the search to locate its new manufacturing facility…arrow_forward1) View the videos Taco Bell test-drives Live Mas restaurant concept in South Bay (0.32 mins, Ctrl+Click on the link) https://www.youtube.com/watch?v=04wRc5Wg8GU , and First-ever Taco Bell Live Mas Café serving exclusive drinks in Chula Vista (1.56 mins, Ctrl+Click on the link) https://www.youtube.com/watch?v=fq6jDxJk1LM , and answer the following questions: a) What is driving Taco Bell to try a beverage-focused format? b) What type of a process strategy does their beverage-focused format represent? c) What operational issues do you think Taco Bell would face from their beverage-focused format? d) What do you think are the main advantages and disadvantages of kiosk ordering? Note: As a rough guideline, please try to keep the written submission to one or two paragraphs for each of the questions. 2) Taipei Pharmaceuticals is planning to open a new manufacturing facility as part of its expansion plans. The firm has narrowed down the search to locate its new manufacturing facility…arrow_forward
- The Clothing Shack is an online retailer of men's, women's, and children's clothing. The company has been in business for four years and makes a modest profit from its online sales. However, in an effort to compete successfully against online retailing heavyweights, the Clothing Shack's marketing director, Makaya O'Neil, has determined that the Clothing Shack's marketing information systems need improvement. Ms. O'Neil feels that the Clothing Shack should begin sending out catalogs to its customers, keep better track of its customer's buying habits, perform target marketing, and provide a more personalized shopping experience for its customers. Several months ago, Ms. O'Neil submitted a systems service request (SSR) to the Clothing Shack's steering committee. The committee unanimously approved this project. You were assigned to the project at that time and have since helped your project team successfully complete the project initiation and planning phase. Your team is now ready to move…arrow_forwardb-1. Activity ES EF LS LF Slack 1 2 3 4 5 6 7 8 9 b-2. Identify the critical activities, and determine the duration of the project. The critical activities are .arrow_forwardThe forecast for each week of a four-week schedule is 50 units. The MPS rule is to schedule production if the projected on-hand Inventory would be negative without it. Customer orders (committed) are follows: Week Customer Order 1 52 35 20 12 Use a production lot size of 75 units and no beginning Inventory. Determine the available-to-promise (ATP) quantities for each period. Note: Leave no cells blank - be certain to enter "0" wherever required. Period ATP 1 2 3arrow_forward
- Prepare a master schedule given this information: The forecast for each week of an eight-week schedule is 60 units. The MPS rule is to schedule production if the projected on-hand Inventory would be negative without it. Customer orders (committed) are as follows: Week Customer Orders 1 2 36 28 4 1 Use a production lot size of 85 units and no beginning inventory. Note: In the ATP row, enter a value of 0 (zero) in any periods where ATP should not be calculated. Leave no cells blank - be certain to enter "0" wherever required. June July 1 2 3 4 5 8 7 8 Forecast 60 60 60 60 60 60 60 60 Customer Orders 38 28 4 1 0 0 0 0 Projected On-Hand Inventory MPS ATParrow_forwardSales of tablet computers at Marika Gonzalez's electronics store in Washington, D.C., over the past 10 weeks are shown in the table below: Week 1 2 3 4 5 6 7 8 9 10 Demand 21 21 27 38 25 30 35 24 25 30 a) The forecast for weeks 2 through 10 using exponential smoothing with a = 0.50 and a week 1 initial forecast of 21.0 are (round your responses to two decimal places): Week 1 2 3 4 5 6 7 8 9 10 Demand 21 21 27 38 25 30 35 24 25 30 Forecast 21.0 21 21 24 31 28 29 32 28 26.50 b) For the forecast developed using exponential smoothing (a = 0.50 and initial forecast 21.0), the MAD = |||||sales (round your response to two decimal places).arrow_forwardSales of tablet computers at Marika Gonzalez's electronics store in Washington, D.C., over the past 10 weeks are shown in the table below: Week Demand 1 2 3 4 5 6 7 8 9 10 21 21 27 38 25 30 35 24 25 30 a) The forecast for weeks 2 through 10 using exponential smoothing with a = 0.50 and a week 1 initial forecast of 21.0 are (round your responses to two decimal places): Week 1 2 3 4 5 Demand 21 21 27 38 Forecast 21.0 ☐ G ☐ ☐ 6 7 25 30 35 ∞ ☐ 8 9 10 24 25 30arrow_forward
- Each machine costs $3 Million. Building the room with all its attendant safety protection and other ancillary costs increases the spending by an additional $2.0 million dollars per MRI suite. Each machine can perform 2000 scans per year. Each reading of an MRI scan by a radiologist, along with other per-scan-related costs, is $500 per scan. The machine will last five years. Don’t worry about discount rates for this problem Graph the total costs over 5 years as a function of sales for 0-3000 patients annually. Hint: you may need to add a second MRI at some point. Suppose that you want to make a profit of $500 per scan at a target volume of 1000 patients per year, and you purchase only one machine. Superimpose the total revenue curve on top of the total cost curve in (1).arrow_forwardI need the answer to requirement C.arrow_forwardImagine you are Susan Kim and are faced with a difficult choice to either follow the orders she was given, or refusing to do so. Using each lens determine what the ethical response would be. Suppot your answer with materials from readings and lectures. For example, using Universalism what would the ethical response be? Do the same for all four lenses.arrow_forward
 Contemporary MarketingMarketingISBN:9780357033777Author:Louis E. Boone, David L. KurtzPublisher:Cengage Learning
 MarketingMarketingISBN:9780357033791Author:Pride, William MPublisher:South Western Educational Publishing
 Practical Management ScienceOperations ManagementISBN:9781337406659Author:WINSTON, Wayne L.Publisher:Cengage,
 Purchasing and Supply Chain ManagementOperations ManagementISBN:9781285869681Author:Robert M. Monczka, Robert B. Handfield, Larry C. Giunipero, James L. PattersonPublisher:Cengage Learning