
Videos
You are interested in analyzing different implant parts being made in a bioengineering production facility. The company can make nine different parts for shoulder, knee, or hip replacement.
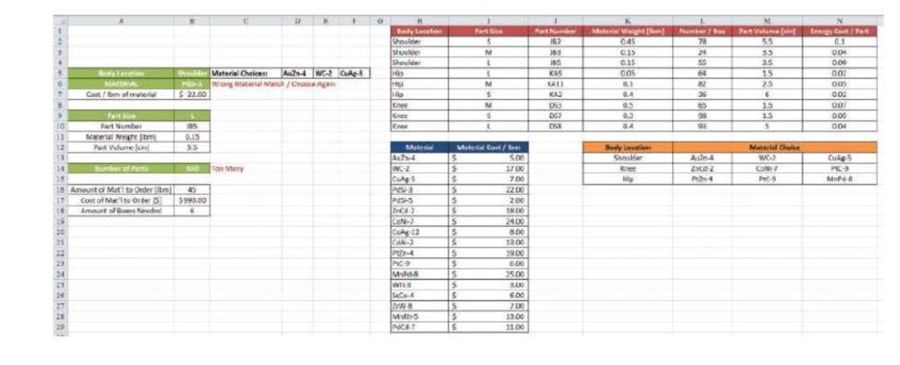
On the worksheet shown, you have created a place for the user to choose the body location (shoulder, knee, or hip) in cell B5 using a data validation list. Once the body location is set, a list of material choices will appear in cells D5 to F5. The user can choose a material in cell B6 using a data validation list. If the material chosen does not match one of the possible choices in cells D5 to F5, a warning will be issued for the user to choose another material.
In cell B9, the user will choose if the part is size small (S), medium (M), or large (L) using a data validation list. Based upon body location and size, the part number will adjust automatically using a VLOOKUP function. After the part number has been determined, the material weight (cell B11) and part volume (cell B12) will adjust automatically using a VLOOKUP function.
The user will enter the number of desired parts in cell B14. If the user requests more than 250 parts, a warning of “Too Many” will be issued; if the user requests fewer than 20 parts, a warning of “Too Small” will be issued in cell C14.
The amount of material to be ordered will be determined in cell B16 by multiplying the number of pans and the material weight. The cost of the material to be ordered will be determined in cell B17. If the order cost is greater than $1000, a request to “Check with Purchasing” will appear, otherwise, the cost of the order will appear. Finally, in cell B18 the amount of boxes needed for shipping will appear determined by the number of parts requested and the number of pans per box, based on the pan number chosen in cell B10.
Lookup functions in Excel contain four parts.
=VLOOKUP (__ (1) __,__(2) __,__ (3) __,__ (4) __)
- a. Fill in the following information in the VLOOKUP function used to determine the third possible material choice in cell F5 based on the choice of body location in cell B5
An IF statement in Excel contains three pans. Fill in the following information in the IF function used to determine the following conditions:
= IF(__ (1) __,__ (2) __,__ (3) __)
- b. In cell C6, a warning is issued to the user if the material chosen in cell B6 does not match the list of materials provided in cells D5 to F5. Fill in the IF statement used to create this error message, containing a complex IF test using AND or OR.
A nested IF statement in Excel contains three parts per IF statement. Fill in the following information in the IF function used to determine the following conditions:
=IF (__ (1a) __,__ (2a) __, IF(__ (1b) __,__ (2b) __,__ (3b) __))
- c. In cell B14, the user can enter the number of parts needed in production. If this value is more than 250 parts, a warning will appear in cell C14 telling the user the quantity is too high; if the value is less than 20, a warring will tell the user the quantity is too small; otherwise, the cell remains blank.
- d. In order for Excel to display the correct number of boxes needed, the following functions are tried. Which one will correctly display the number of boxes needed to ship the parts?
- A. = B14/VLOOKUP(B10, J1:L10, 3, FALSE)
- B. = ROUND(B14/VLOOKUP(B10, J1:L10, 3, FALSE), 0)
- C. = ROUNDDOWN(B14/VLOOKUP(B10, J1:L10, 3, FALSE),0)
- D. = ROUNDUP(B14/VLOOKUP(B10, J1:L10, 3, FALSE), 0)
- E. = TRUNC(B14 VLOOKUP(B10, J1:L10, 3, FALSE), 0)
Want to see the full answer?
Check out a sample textbook solution
Chapter 10 Solutions
Thinking Like an Engineer: An Active Learning Approach (4th Edition)
Additional Engineering Textbook Solutions
Vector Mechanics For Engineers
Thermodynamics: An Engineering Approach
Electric Circuits. (11th Edition)
Database Concepts (8th Edition)
Automotive Technology: Principles, Diagnosis, And Service (6th Edition) (halderman Automotive Series)
Starting Out with Java: From Control Structures through Objects (7th Edition) (What's New in Computer Science)


- = MMB 241 Tutorial 2.pdf 3/3 75% + + 6. A particle is traveling along the parabolic path y = 0.25 x². If x = 8 m, vx=8 m/s, and ax= 4 m/s² when t = 2 s, determine the magnitude of the particle's velocity and acceleration at this instant. y = 0.25x² -x 7. Determine the speed at which the basketball at A must be thrown at the angle of 30° so that it makes it to the basket at B. 30° -x 1.5 m B 3 m -10 m- 8. The basketball passed through the hoop even though it barely cleared the hands of the player B who attempted to block it. Neglecting the size of the ball, determine the 2arrow_forwardAdhesives distribute loads across the interface, whereas fasteners create areas of localized stresses. True or Falsearrow_forwardA continuous column flash system is separating 100 kmol/h of a saturated liquid feed that is 45 mol% methanol and 55 mol% water at 1.0 atm. Operate with L/V = 1.5 and the outlet bottoms at xN = 0.28. Find the values of FL, FV, y1, and the number of equilibrium stages required. Find the value of Q used to vaporize FV. For a normal flash with the same feed and the same V/F, find the values of x and y.arrow_forward
- A beer still is being used to separate ethanol from water at 1.0 atm. The saturated liquid feed flow rate is F = 840.0 kmol/h. The feed is 44.0 mol% ethanol. The saturated vapor steam is pure water with ratio of steam flow rate S to feed rate, S/F = 2/3. We desire a bottoms product that is 4.0 mol% ethanol. CMO is valid. Find the mole fraction of ethanol in the distillate vapor, yD,E. Find the number of equilibrium stages required. If the feed is unchanged and the S/F ratio is unchanged, but the number of stages is increased to a very large number, what is the lowest bottoms mole fraction of ethanol that can be obtained?arrow_forward3.1 Convert the following base-2 numbers to base-10: (a) 1011001, (b) 110.0101, and (c) 0.01011.arrow_forwardConsider the forces acting on the handle of the wrench in (Figure 1). a) Determine the moment of force F1={−F1={−2i+i+ 4 jj −−8k}lbk}lb about the zz axis. Express your answer in pound-inches to three significant figures. b) Determine the moment of force F2={F2={3i+i+ 7 jj −−6k}lbk}lb about the zz axis. Express your answer in pound-inches to three significant figures.arrow_forward
- I need you to explain each and every step (Use paper)arrow_forwardCalculate the Moment About the Point A -20"- 5 lb 40 N D 1.5 m 40 N 4.5 m A 15 lb. 150 mm 52 N 5 12 100 mm 15 lb. 26 lb. 12 5 34 lb. 13 8 15 77777 36 lb.arrow_forwardCalculate the Moment About the Point A -20"- 5 lb 40 N D 1.5 m 40 N 4.5 m A 15 lb. 150 mm 52 N 5 12 100 mm 15 lb. 26 lb. 12 5 34 lb. 13 8 15 77777 36 lb.arrow_forward
- Formala for Hunzontal component= + cos & Vertical Component: Fsin t Find the vertical and horizontal components for the figure bellow: 30° 200 N 77 200 cos 30 = 173 N // 200 sin 30 = 100 N YA a₂+b₂ b₂ (b₁,b₂) a+b 20haits (a+b₁,a+b) Magnitude a and b a = lbl = 2o unite rugle of vector a wt Horisontal Axis = 30 11 vector & wt Honzontal Axis - 60° b b a= |a| Cas 30 a2 (a1, a2) ag = 10 bx = /b/ cos a 1 20 cos 80 = 17.32 Sia 30 = 20 sin 30. 60 = 10 = 20 Cos 60 = It by = 161 sin 60 = 20 sia 60 = 17.32 b₁ Rx ax +bx = 17.32 +10=2732 a₁ a₁+b₁ X By = ou + by= + + by = 10 + 17.32 =27.32 Magnitude = 38.637 Find the Vector a +b the Resultans The angle of the vector with the horizontal axle is 30 degrees while the angle of the vector b is 60 degrees. The magnitude of both vectors is 20 (units) angle of the Resultant vector = tam- " (14) 45arrow_forwardThe net force exerted on the piston by the exploding fuel-air mixture and friction is 5 kN to the left. A clockwise couple M = 200 N-m acts on the crank AB. The moment of inertia of the crank about A is 0.0003 kg-m2 . The mass of the connecting rod BC is 0.36 kg, and its center of mass is 40 mm from B on the line from B to C. The connecting rod’s moment of inertia about its center of mass is 0.0004 kg-m2 . The mass of the piston is 4.6 kg. The crank AB has a counterclockwise angular velocity of 2000 rpm at the instant shown. Neglect the gravitational forces on the crank, connecting rod, and piston – they still have mass, just don’t include weight on the FBDs. What is the piston’s acceleration?arrow_forwardSolve only no 1 calculations,the one with diagram,I need handwritten expert solutionsarrow_forward
 Principles of Heat Transfer (Activate Learning wi...Mechanical EngineeringISBN:9781305387102Author:Kreith, Frank; Manglik, Raj M.Publisher:Cengage Learning