Concept explainers
Videos
In some cases, users want to use Access and Excel together. They process relational data with Access, import some of the data into Excel, and use Excel’s tools for creating professional-looking charts and graphs. You will do exactly that in this exercise.
FIGURE AE-3 Data Displayed in Pie-Chart Format
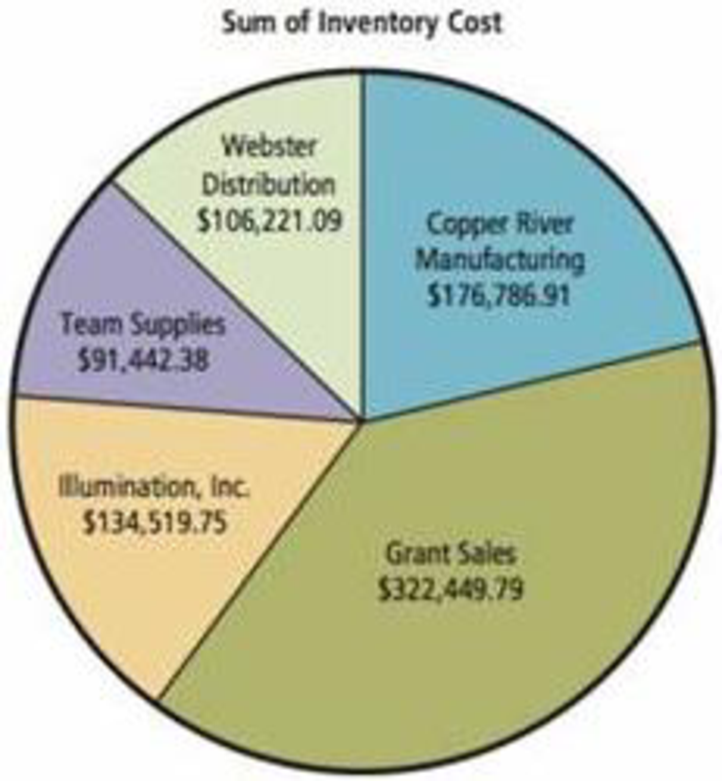
Source: Microsoft Corporation
Download the Access file Ch05Ex01_U10e.accdb. Open the
For this problem, we will define InventoryCost as the product of Industry-Standard-Cost and QuantityOnHand. The query InventoryCost computes these values for every item in inventory for every vendor. Open that query and view the data to be certain you understand this computation. Open the other queries as well so that you understand the data they produce.
- a. Sum this data by vendor and display it in a pie chart like that shown in Figure AE-3 (your totals will be different from those shown). Proceed as follows:
- (1) Open Excel and create a new spreadsheet.
- (2) Click DATA on the ribbon and select From Access in the Get External Data ribbon category.
- (3) Navigate to the location in which you have stored the Access file Ch05Ex01_U10e.accdb.
- (4) Select the query that contains the data you need for this pie chart.
- (5) Import the data into a worksheet.
- (6) Format the appropriate data as currency.
- (7) Select the range that contains the data, press the Function key, and proceed from there to create the pie chart. Name the data and pie chart worksheets appropriately.
h. Follow a similar procedure to create the bar chart shown in Figure AE-4. Again, your data will be different. Place the data and the chart in separate worksheets and name them appropriately.
FIGURE AE-4 Data Displayed in Bar-Chart Format
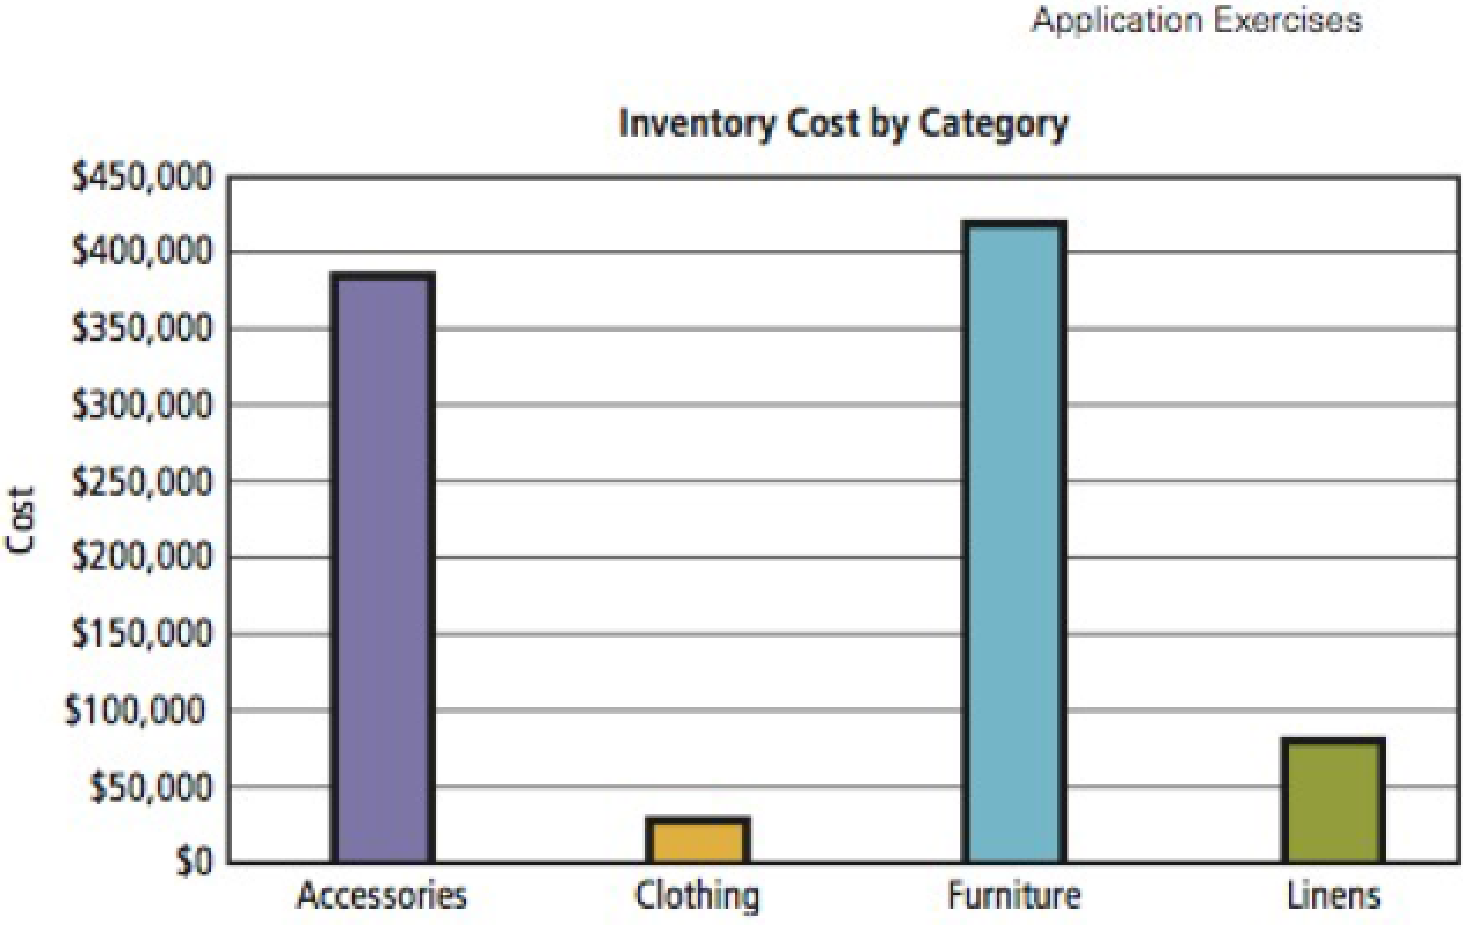
Source: Microsoft Corporation
Want to see the full answer?
Check out a sample textbook solution
Chapter AE Solutions
Using MIS (10th Edition)
Additional Engineering Textbook Solutions
Starting Out with Programming Logic and Design (5th Edition) (What's New in Computer Science)
SURVEY OF OPERATING SYSTEMS
Database Concepts (8th Edition)
Modern Database Management
Automotive Technology: Principles, Diagnosis, And Service (6th Edition) (halderman Automotive Series)
Thinking Like an Engineer: An Active Learning Approach (4th Edition)


- what is a feature in the Windows Server Security Compliance Toolkit, thank you.arrow_forwardYou will write a program that allows the user to keep track of college locations and details about each location. To begin you will create a College python class that keeps track of the csollege's unique id number, name, address, phone number, maximum students, and average tuition cost. Once you have built the College class, you will write a program that stores College objects in a dictionary while using the College's unique id number as the key. The program should display a menu in this order that lets the user: 1) Add a new College 2) Look up a College 4) Delete an existing College 5) Change an existing College's name, address, phone number, maximum guests, and average tuition cost. 6) Exit the programarrow_forwardShow all the workarrow_forward
- Show all the workarrow_forward[5 marks] Give a recursive definition for the language anb2n where n = 1, 2, 3, ... over the alphabet Ó={a, b}. 2) [12 marks] Consider the following languages over the alphabet ={a ,b}, (i) The language of all words that begin and end an a (ii) The language where every a in a word is immediately followed by at least one b. (a) Express each as a Regular Expression (b) Draw an FA for each language (c) For Language (i), draw a TG using at most 3 states (d) For Language (ii), construct a CFG.arrow_forwardQuestion 1 Generate a random sample of standard lognormal data (rlnorm()) for sample size n = 100. Construct histogram estimates of density for this sample using Sturges’ Rule, Scott’s Normal Reference Rule, and the FD Rule. Question 2 Construct a frequency polygon density estimate for the sample in Question 1, using bin width determined by Sturges’ Rule.arrow_forward
- Generate a random sample of standard lognormal data (rlnorm()) for sample size n = 100. Construct histogram estimates of density for this sample using Sturges’ Rule, Scott’s Normal Reference Rule, and the FD Rule.arrow_forwardCan I get help with this case please, thank youarrow_forwardI need help to solve the following, thank youarrow_forward
 Np Ms Office 365/Excel 2016 I NtermedComputer ScienceISBN:9781337508841Author:CareyPublisher:Cengage
 A Guide to SQLComputer ScienceISBN:9781111527273Author:Philip J. PrattPublisher:Course Technology Ptr
 Database Systems: Design, Implementation, & Manag...Computer ScienceISBN:9781305627482Author:Carlos Coronel, Steven MorrisPublisher:Cengage Learning
 Database Systems: Design, Implementation, & Manag...Computer ScienceISBN:9781285196145Author:Steven, Steven Morris, Carlos Coronel, Carlos, Coronel, Carlos; Morris, Carlos Coronel and Steven Morris, Carlos Coronel; Steven Morris, Steven Morris; Carlos CoronelPublisher:Cengage Learning