
Statistics for Engineers and Scientists
4th Edition
ISBN: 9780073401331
Author: William Navidi Prof.
Publisher: McGraw-Hill Education
expand_more
expand_more
format_list_bulleted
Concept explainers
Videos
Textbook Question
Chapter 9.1, Problem 1E
A study is made of the effect of curing temperature on the compressive strength of a certain type of concrete. Five concrete specimens are cured at each of four temperatures, and the compressive strength of each specimen is measured (in MPa). The results are as follows:
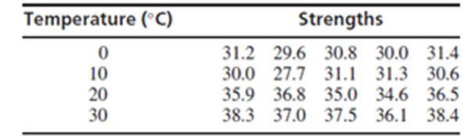
- a. Construct an ANOVA table. You may give a
range for the P-value. - b. Can you conclude that the mean strength differs with temperature?
Expert Solution & Answer
Want to see the full answer?
Check out a sample textbook solution
Students have asked these similar questions
Une Entreprise œuvrant dans le domaine du multividéo donne l'opportunité à ses
programmeurs-analystes d'évaluer la performance des cadres supérieurs.
Voici les résultats obtenues (sur une échelle de 10 à 50) où 50 représentent une
excellente performance. 10 programmeurs furent sélectionnés au hazard pour
évaluer deux cadres. Un rapport Excel est également fourni.
Programmeurs
Cadre A Cadre B
1
34
36
2
32
34
3
18
19
33
38
19
21
21
23
7
35
34
8
20
20
9
34
34
10
36
34
Test d'égalité des espérances: observations pairées
A television news channel samples 25 gas stations from its local area and uses the results to estimate the average gas price for the state. What’s wrong with its margin of error?
You’re fed up with keeping Fido locked inside, so you conduct a mail survey to find out people’s opinions on the new dog barking ordinance in a certain city. Of the 10,000 people who receive surveys, 1,000 respond, and only 80 are in favor of it. You calculate the margin of error to be 1.2 percent. Explain why this reported margin of error is misleading.
Chapter 9 Solutions
Statistics for Engineers and Scientists
Ch. 9.1 - A study is made of the effect of curing...Ch. 9.1 - The article Nutrient Deprivation Improves Field...Ch. 9.1 - Prob. 3ECh. 9.1 - The antibiotic gentamicin sulphate is often...Ch. 9.1 - The article influence of Age on Masonry Bond...Ch. 9.1 - Archaeologists can determine the diets of ancient...Ch. 9.1 - The article Secretion of Parathyroid Hormone...Ch. 9.1 - The article Impact of Free Calcium Oxide Content...Ch. 9.1 - A certain chemical reaction was run three times at...Ch. 9.1 - An experiment to compare the lifetimes of four...
Ch. 9.1 - Prob. 11ECh. 9.1 - Prob. 12ECh. 9.1 - Prob. 13ECh. 9.1 - Prob. 14ECh. 9.1 - Refer to Exercise 12. a. Compute the quantity...Ch. 9.1 - Prob. 16ECh. 9.1 - Prob. 17ECh. 9.1 - Prob. 18ECh. 9.1 - Prob. 19ECh. 9.1 - The following MINITAB output presents a power...Ch. 9.2 - Exercises for Section 9.2 1.The article Organic...Ch. 9.2 - The article Optimum Design of an A-pillar Trim...Ch. 9.2 - Prob. 3ECh. 9.2 - Refer to Exercise 2 in Section 9.1. a.Use the...Ch. 9.2 - Refer to Exercise 13 in Section 9.1. a. Use the...Ch. 9.2 - Refer to Exercise 1 in Section 9.1. A scientist...Ch. 9.2 - Refer to Exercise 13 in Section 9.1. A...Ch. 9.2 - Refer to Exercise 3 in Section 9.1. a. Use the...Ch. 9.2 - Refer to Exercise 5 in Section 9.1. a. Use the...Ch. 9.2 - Refer to Exercise 9 in Section 9.1. a. Use the...Ch. 9.2 - Refer to Exercise 16 in Section 9.1. a. Use the...Ch. 9.2 - Refer to Exercise 18 in Section 9.1. a. Use the...Ch. 9.2 - In an experiment to determine the effect of...Ch. 9.2 - In an experiment to determine the effect of curing...Ch. 9.2 - Prob. 15ECh. 9.2 - For some data sets, the F statistic will reject...Ch. 9.3 - To assess the effect of piston ring type and oil...Ch. 9.3 - A machine shop has three machines used in...Ch. 9.3 - An experiment to determine the effect of mold...Ch. 9.3 - The effect of curing pressure on bond strength was...Ch. 9.3 - The article Change in Creep Behavior of Plexiform...Ch. 9.3 - Prob. 6ECh. 9.3 - Prob. 7ECh. 9.3 - Adding glass panicles to clay brick may improve...Ch. 9.3 - The article Application of Radial Basis Function...Ch. 9.3 - Prob. 10ECh. 9.3 - Prob. 11ECh. 9.3 - The article Anodic Fenton Treatment of Treflan MTF...Ch. 9.3 - Refer to Exercise 12. The treatments with a...Ch. 9.3 - The article Use of Taguchi Methods and Multiple...Ch. 9.3 - The article T-Bracing for Stability of Compression...Ch. 9.3 - The article referred to in Exercise 15 also...Ch. 9.3 - Prob. 17ECh. 9.3 - Prob. 18ECh. 9.3 - The article Cellulose Acetate Microspheres...Ch. 9.4 - Recycling newsprint is important in reducing...Ch. 9.4 - A study was done to see which of four machines is...Ch. 9.4 - Prob. 3ECh. 9.4 - Three different corrosion-resistant coatings are...Ch. 9.4 - The article Genotype-Environment Interactions and...Ch. 9.4 - The article Sprinkler Technologies, Soil...Ch. 9.4 - The article Bromate Surveys in French Drinking...Ch. 9.4 - The article Multi-objective Scheduling Problems:...Ch. 9.4 - You have been given the task of designing a study...Ch. 9.4 - An engineering professor wants to determine which...Ch. 9.5 - Prob. 1ECh. 9.5 - Give an example of a factorial experiment in which...Ch. 9.5 - Prob. 3ECh. 9.5 - The article Efficient Pyruvate Production by a...Ch. 9.5 - The article cited in Exercise 4 also investigated...Ch. 9.5 - A metal casting process for the production of...Ch. 9.5 - The article An Investigation into the Ball...Ch. 9.5 - In a 2p design with one replicate per treatment,...Ch. 9.5 - Prob. 9ECh. 9.5 - Prob. 10ECh. 9.5 - The article Factorial Design for Column Rotation...Ch. 9.5 - Prob. 12ECh. 9.5 - Prob. 13ECh. 9 - The article Gypsum Effect on the Aggregate Size...Ch. 9 - Prob. 2SECh. 9 - Prob. 3SECh. 9 - Prob. 4SECh. 9 - Prob. 5SECh. 9 - Prob. 6SECh. 9 - Prob. 7SECh. 9 - The article Case Study Based Instruction of DOE...Ch. 9 - The article Combined Analysis of Real-Time...Ch. 9 - Vermont maple sugar producers sponsored a testing...Ch. 9 - Prob. 11SECh. 9 - Prob. 12SECh. 9 - Prob. 13SECh. 9 - The article Enthalpies and Entropies of Transfer...Ch. 9 - Prob. 15SECh. 9 - Prob. 16SECh. 9 - The article Factorial Experiments in the...Ch. 9 - The Williamsburg Bridge is a suspension bridge...Ch. 9 - Prob. 19SECh. 9 - In the article Nitrate Contamination of Alluvial...Ch. 9 - The article Factorial Experiments in the...Ch. 9 - Prob. 22SECh. 9 - Prob. 23SECh. 9 - Prob. 24SE
Additional Math Textbook Solutions
Find more solutions based on key concepts
For Problems 23-28, write in simpler form, as in Example 4. logbFG
Finite Mathematics for Business, Economics, Life Sciences and Social Sciences
Provide an example of a qualitative variable and an example of a quantitative variable.
Elementary Statistics ( 3rd International Edition ) Isbn:9781260092561
NOTE: Write your answers using interval notation when appropriate.
CHECKING ANALYTIC SKILLS Fill in each blank ...
Graphical Approach To College Algebra
153. A rain gutter is made from sheets of aluminum that are 20 inches wide. As shown in the figure, the edges ...
College Algebra (7th Edition)
The first derivative of function y=25x4.
Calculus for Business, Economics, Life Sciences, and Social Sciences (14th Edition)
(a) Make a stem-and-leaf plot for these 24 observations on the number of customers who used a down-town CitiBan...
APPLIED STAT.IN BUS.+ECONOMICS
Knowledge Booster


Learn more about
Need a deep-dive on the concept behind this application? Look no further. Learn more about this topic, statistics and related others by exploring similar questions and additional content below.Similar questions
- You find out that the dietary scale you use each day is off by a factor of 2 ounces (over — at least that’s what you say!). The margin of error for your scale was plus or minus 0.5 ounces before you found this out. What’s the margin of error now?arrow_forwardSuppose that Sue and Bill each make a confidence interval out of the same data set, but Sue wants a confidence level of 80 percent compared to Bill’s 90 percent. How do their margins of error compare?arrow_forwardSuppose that you conduct a study twice, and the second time you use four times as many people as you did the first time. How does the change affect your margin of error? (Assume the other components remain constant.)arrow_forward
- Out of a sample of 200 babysitters, 70 percent are girls, and 30 percent are guys. What’s the margin of error for the percentage of female babysitters? Assume 95 percent confidence.What’s the margin of error for the percentage of male babysitters? Assume 95 percent confidence.arrow_forwardYou sample 100 fish in Pond A at the fish hatchery and find that they average 5.5 inches with a standard deviation of 1 inch. Your sample of 100 fish from Pond B has the same mean, but the standard deviation is 2 inches. How do the margins of error compare? (Assume the confidence levels are the same.)arrow_forwardA survey of 1,000 dental patients produces 450 people who floss their teeth adequately. What’s the margin of error for this result? Assume 90 percent confidence.arrow_forward
- The annual aggregate claim amount of an insurer follows a compound Poisson distribution with parameter 1,000. Individual claim amounts follow a Gamma distribution with shape parameter a = 750 and rate parameter λ = 0.25. 1. Generate 20,000 simulated aggregate claim values for the insurer, using a random number generator seed of 955.Display the first five simulated claim values in your answer script using the R function head(). 2. Plot the empirical density function of the simulated aggregate claim values from Question 1, setting the x-axis range from 2,600,000 to 3,300,000 and the y-axis range from 0 to 0.0000045. 3. Suggest a suitable distribution, including its parameters, that approximates the simulated aggregate claim values from Question 1. 4. Generate 20,000 values from your suggested distribution in Question 3 using a random number generator seed of 955. Use the R function head() to display the first five generated values in your answer script. 5. Plot the empirical density…arrow_forwardFind binomial probability if: x = 8, n = 10, p = 0.7 x= 3, n=5, p = 0.3 x = 4, n=7, p = 0.6 Quality Control: A factory produces light bulbs with a 2% defect rate. If a random sample of 20 bulbs is tested, what is the probability that exactly 2 bulbs are defective? (hint: p=2% or 0.02; x =2, n=20; use the same logic for the following problems) Marketing Campaign: A marketing company sends out 1,000 promotional emails. The probability of any email being opened is 0.15. What is the probability that exactly 150 emails will be opened? (hint: total emails or n=1000, x =150) Customer Satisfaction: A survey shows that 70% of customers are satisfied with a new product. Out of 10 randomly selected customers, what is the probability that at least 8 are satisfied? (hint: One of the keyword in this question is “at least 8”, it is not “exactly 8”, the correct formula for this should be = 1- (binom.dist(7, 10, 0.7, TRUE)). The part in the princess will give you the probability of seven and less than…arrow_forwardplease answer these questionsarrow_forward
- Selon une économiste d’une société financière, les dépenses moyennes pour « meubles et appareils de maison » ont été moins importantes pour les ménages de la région de Montréal, que celles de la région de Québec. Un échantillon aléatoire de 14 ménages pour la région de Montréal et de 16 ménages pour la région Québec est tiré et donne les données suivantes, en ce qui a trait aux dépenses pour ce secteur d’activité économique. On suppose que les données de chaque population sont distribuées selon une loi normale. Nous sommes intéressé à connaitre si les variances des populations sont égales.a) Faites le test d’hypothèse sur deux variances approprié au seuil de signification de 1 %. Inclure les informations suivantes : i. Hypothèse / Identification des populationsii. Valeur(s) critique(s) de Fiii. Règle de décisioniv. Valeur du rapport Fv. Décision et conclusion b) A partir des résultats obtenus en a), est-ce que l’hypothèse d’égalité des variances pour cette…arrow_forwardAccording to an economist from a financial company, the average expenditures on "furniture and household appliances" have been lower for households in the Montreal area than those in the Quebec region. A random sample of 14 households from the Montreal region and 16 households from the Quebec region was taken, providing the following data regarding expenditures in this economic sector. It is assumed that the data from each population are distributed normally. We are interested in knowing if the variances of the populations are equal. a) Perform the appropriate hypothesis test on two variances at a significance level of 1%. Include the following information: i. Hypothesis / Identification of populations ii. Critical F-value(s) iii. Decision rule iv. F-ratio value v. Decision and conclusion b) Based on the results obtained in a), is the hypothesis of equal variances for this socio-economic characteristic measured in these two populations upheld? c) Based on the results obtained in a),…arrow_forwardA major company in the Montreal area, offering a range of engineering services from project preparation to construction execution, and industrial project management, wants to ensure that the individuals who are responsible for project cost estimation and bid preparation demonstrate a certain uniformity in their estimates. The head of civil engineering and municipal services decided to structure an experimental plan to detect if there could be significant differences in project evaluation. Seven projects were selected, each of which had to be evaluated by each of the two estimators, with the order of the projects submitted being random. The obtained estimates are presented in the table below. a) Complete the table above by calculating: i. The differences (A-B) ii. The sum of the differences iii. The mean of the differences iv. The standard deviation of the differences b) What is the value of the t-statistic? c) What is the critical t-value for this test at a significance level of 1%?…arrow_forward
arrow_back_ios
SEE MORE QUESTIONS
arrow_forward_ios
Recommended textbooks for you
 Glencoe Algebra 1, Student Edition, 9780079039897...AlgebraISBN:9780079039897Author:CarterPublisher:McGraw Hill
 Big Ideas Math A Bridge To Success Algebra 1: Stu...AlgebraISBN:9781680331141Author:HOUGHTON MIFFLIN HARCOURTPublisher:Houghton Mifflin Harcourt
Glencoe Algebra 1, Student Edition, 9780079039897...
Algebra
ISBN:9780079039897
Author:Carter
Publisher:McGraw Hill
Big Ideas Math A Bridge To Success Algebra 1: Stu...
Algebra
ISBN:9781680331141
Author:HOUGHTON MIFFLIN HARCOURT
Publisher:Houghton Mifflin Harcourt
Statistics 4.1 Point Estimators; Author: Dr. Jack L. Jackson II;https://www.youtube.com/watch?v=2MrI0J8XCEE;License: Standard YouTube License, CC-BY
Statistics 101: Point Estimators; Author: Brandon Foltz;https://www.youtube.com/watch?v=4v41z3HwLaM;License: Standard YouTube License, CC-BY
Central limit theorem; Author: 365 Data Science;https://www.youtube.com/watch?v=b5xQmk9veZ4;License: Standard YouTube License, CC-BY
Point Estimate Definition & Example; Author: Prof. Essa;https://www.youtube.com/watch?v=OTVwtvQmSn0;License: Standard Youtube License
Point Estimation; Author: Vamsidhar Ambatipudi;https://www.youtube.com/watch?v=flqhlM2bZWc;License: Standard Youtube License