
Concept explainers
Videos
a.
To estimate: the number of unemployed workers in the 16-19 age group.
a.
Answer to Problem 54E
The number of unemployed workers in the 16-19 age group is 0.8376 million.
Explanation of Solution
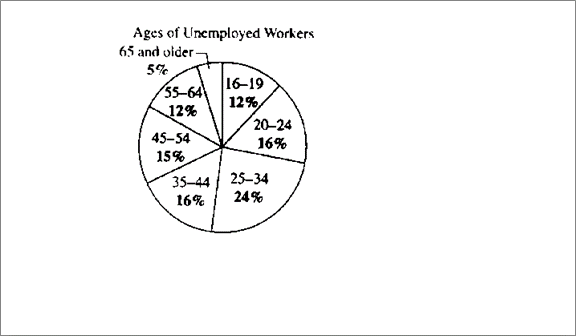
Given information: There were approximately 6.98 million unemployed workers in the
U.S. The below circle graph shows the age profile of these unemployed workers.

Calculation:
The total number of unemployed workers
From the graph the number of unemployed workers in the 16-19 age group=12% of 6.98.
The number of unemployed workers in the 16-19 age group,
b.
To estimate: the number of unemployed workers who are 45 years or older.
b.
Answer to Problem 54E
The number of unemployed workers who are 45 years or older is 2.2336 million.
Explanation of Solution
Given information: There were approximately 6.98 million unemployed workers in the
U.S. The below circle graph shows the age profile of these unemployed workers.

Calculation:
The total number of unemployed workers
From the graph the number of unemployed workers who are 45 years or older= 45-54 year group+ 55-64 year group +65 and older year group=15%+12%+5%=32% of 6.98.
The number of unemployed workers who are 45 years or older,
c.
To find: the probability that a person selected at random from the population of unemployed workers is in the 25-44 age group.
c.
Answer to Problem 54E
The probability that a person selected at random from the population of unemployed workers is in the 25-44 age group is 0.4.
Explanation of Solution
Given information: There were approximately 6.98 million unemployed workers in the
U.S. The below circle graph shows the age profile of these unemployed workers.

Calculation:
The total number of unemployed workers
From the graph the number of unemployed workers is in the 25-44 age group=25-34 age group + 35-44 age group=24%+16%=40% of 6.98.
So, the number of unemployed workers is in the 25-44 age group,
The probability that a person selected at random from the population of unemployed workers is in the 25-44 age group=(number of unemployed workers is in the 25-44 age group/total number of unemployed workers).
The probabilityof unemployed workers is in the 25-44 age group
d.
To find: the probability that a person selected at random from the population of unemployed workers is in the 25-64 age group.
d.
Answer to Problem 54E
The probabilityof unemployed workers is in the 25-64 age group is 0.67.
Explanation of Solution
Given information: There were approximately 6.98 million unemployed workers in the
U.S. The below circle graph shows the age profile of these unemployed workers.
Calculation:
The total number of unemployed workers
From the graph the number of unemployed workers is in the 25-64 age group=25-34 age group + 35-44 age group+45-54 age group +55-64 age group ,
= 24%+16%+15%+12%=67% of 6.98.
So, the number of unemployed workers is in the 25-64 age group,
The probability that a person selected at random from the population of unemployed workers is in the 25-64 age group=(number of unemployed workers is in the 25-64 age group/total number of unemployed workers).
The probabilityof unemployed workers is in the 25-64 age group
Chapter 8 Solutions
PRECALCULUS W/LIMITS:GRAPH.APPROACH(HS)


- Don't do 14. Please solve 19arrow_forwardPlease solve 14 and 15arrow_forward1. Consider the following system of equations: x13x2 + 4x3 - 5x4 = 7 -2x13x2 + x3 - 6x4 = 7 x16x213x3 - 21x4 = 28 a) Solve the system. Write your solution in parametric and vector form. b) What is a geometric description of the solution. 7 c) Is v = 7 in the span of the set S= [28. 1 HE 3 -5 3 ·6 ? If it is, write v 6 as a linear combination of the vectors in S. Justify. d) How many solutions are there to the associated homogeneous system for the system above? Justify. e) Let A be the coefficient matrix from the system above. Find the set of all solutions to Ax = 0. f) Is there a solution to Ax=b for all b in R³? Justify.arrow_forward
- 4. Suppose that A is made up of 5 column vectors in R³, and suppose that the rank(A)=3. a. How many solutions are there to Ax=0? Justify. b. What is a geometric description for the nullspace(A)? Justify. c. Do the column vectors of A span R³? Justify. d. Is A invertible? Justify.arrow_forward3. Suppose that A is 5 x 5 and rank(A)=4. Use this information to answer the following. a. Give a geometric description of nullspace(A). Justify. b. Is A invertible? Justify. c. Give a geometric description of the span of the column vectors of A. What space are the column vectors of A in? Justify. d. What is determinant of A? Justify.arrow_forward2. Consider the matrix: A || 1 1 -3 14 2 1 01 4 1 2 2 -26 1 -3 1 5] a) What is rank(A)? b) Is A invertible? Justify. c) Find the nullspace(A). Justify. d) Is the trivial solution the only solution to Ax=0? Justify. e) What is the span of the column vectors of A? Justify.arrow_forward
- E 5. Suppose that S={v € R²: v = [2x² - 3]}. Is S a subspace of R²? Prove or disprovearrow_forward6. Suppose that V1, V2 ER", show that span{v1, v2} is a subspace of Rn.arrow_forwardRa X 2) slots per pole per phase 3/31 180 Ko Sin (1) Kdl 1 sin (4) sin(3) Sin (30) اذا مرید شرح الكتب بس 0 بالفراغ 3) Cos (30) 0.866 4) Rotating 5) Synchronous speed, 120 Fo lasa! G s.1000-950 20:05 1000 Capper losses: 5kw Rotor input lookw 0.05 ined sove in peaper I need a detailed solution on paper please 6) 1 ۳/۱ وه اذا ميريد شرح الكتب فقط look DC 7) rotov Find the general solution of the following equations: +4y=tan2x 3 7357 Find the general solution of the following equations: - Qll y + y (³) = 0. 101arrow_forward
- B: 18060 msl Kd Ka, Sin (n) I sin () sin(30) Sin (30) اذا ميريد شرح الكتب بس 0 بالفراغ 3) Cos (30) 0.866 4) Rotating 5) Synchronous speed, 120 x 50 G 5005 1000 s = 1000-950 Copper bosses 5kW /0001 Rotor input 5 : loo kw 0.05 6) 1 اذا ميريد شرح الكتب فقط ١٥٠ 7) rotov DC ined sove in Deaper I need a detailed solution on paper please dy x+2y-4 = dx 2x-y-3 Find the general solution of the following equations: 02//yl-4y+13y=esinarrow_forward1) R₂ = X2 2) slots per pole per phase = 3/31 B msl kd 180 60 Kal Sin (1) I sin () sin(30) Sin (30) اذا ميريد شرح الكتب بس 0 بالفراغ 3) Cos (30) 0.866 4) Rotating 5) Synchronous speed, 120 x 50 G 5005 1000 s = 1000-950 Copper bosses 5kW Rotor input: 5 0.05 loo kw 6) 1 /0001 اذا ميريد شرح الكتب فقط look 7) rotov DC ined sove in peaper I need a detailed solution on paper please Q1// Find the solution of: 'y' = x² +376 x4+316 xyo Q2 Find the solution of the initial-valued problems: ex-y y' +exarrow_forwardR₂ = X2 2) slots per pole per phase = 3/31 B-18060 msl kd Kasi Sin (1) I sin (6) sin(30) Sin (30) اذا ميريد شرح الكتب بس 0 بالفراغ 3) Cos (30) 0.866 4) Rotating 5) Synchronous speed s = 1000-950 1000 Copper losses: 5kw Rotor input 5 0.05 6) 1 120 x 50 G loo kw ined sove in peaper I need a detailed solution on paper please Q3// x²y// +xy/ + (x² - ½) y = x³/². اذا ميريد شرح الكتب فقط look 7) rotor DC Q4// x²y// - (2x+x²)y/ + (2 + x)y = x³. dy 2x+2y+4 = dx 2x-y-3arrow_forward
 Calculus: Early TranscendentalsCalculusISBN:9781285741550Author:James StewartPublisher:Cengage Learning
 Thomas' Calculus (14th Edition)CalculusISBN:9780134438986Author:Joel R. Hass, Christopher E. Heil, Maurice D. WeirPublisher:PEARSON
 Calculus: Early Transcendentals (3rd Edition)CalculusISBN:9780134763644Author:William L. Briggs, Lyle Cochran, Bernard Gillett, Eric SchulzPublisher:PEARSON
 Calculus: Early TranscendentalsCalculusISBN:9781319050740Author:Jon Rogawski, Colin Adams, Robert FranzosaPublisher:W. H. Freeman
 Calculus: Early Transcendental FunctionsCalculusISBN:9781337552516Author:Ron Larson, Bruce H. EdwardsPublisher:Cengage Learning