
Concept explainers
Videos
a.
To find: a linear sequence and a quadratic sequence that model the given data and identify the coefficient of determination for each model.
a.
Answer to Problem 129E
Linear sequence:
Quadratic sequence:
Explanation of Solution
Given information: The revenue
2017 are shown in the below table.
| Year | Revenue, |
| 2012 | 3609.3 |
| 2013 | 4374.6 |
| 2014 | 5504.7 |
| 2015 | 6779.5 |
| 2016 | 8830.7 |
| 2017 | 11,692.8 |
Calculation:
Let n =2 corresponding to 2012 then the above table will be:
| Year | Revenue, |
| 2 | 3609.3 |
| 3 | 4374.6 |
| 4 | 5504.7 |
| 5 | 6779.5 |
| 6 | 8830.7 |
| 7 | 11,692.8 |
Using the graphing calculator on the above table data.
Linear sequence:
Quadratic sequence:
b.
To graph: each model with the data and decide which model is a better fit for the data.
b.
Explanation of Solution
Given information:
Calculation:
The graph of each model is shown below.
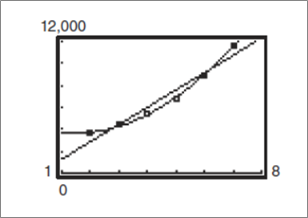
The quadratic sequence is the better fit, because the coefficient of determination is close to 1.
c.
To predict: the revenue of Netflix in 2021 using the model in part (b).
c.
Answer to Problem 129E
The revenue in 2021 is about $ 26,975.7 million.
Explanation of Solution
Given information:
Calculation:
Let n =11 for 2021
Therefore, the revenue in 2021 is about $ 26,975.7 million.
d.
To find: when the revenue will reach 50 billion dollars using the modal from part (b).
d.
Answer to Problem 129E
The revenue will reach $50 billion in 2024.
Explanation of Solution
Given information:
Calculation:
Let R =50,000.
Therefore, the revenue will reach $50 billion in 2024.
e.
To approximate: the total revenue from 2012 through 2017 and compare this sum with the result of adding the revenue shown in the table.
e.
Answer to Problem 129E
The total revenue from 2012to 2017 is about $40,791.47 million. This sum is very close to the sum of the values shown in the above table data, which is $40,791.6 million.
Explanation of Solution
Given information:
Calculation:
The total revenue from 2012to 2017 is:
Therefore, the total revenue from 2012to 2017 is about $40,791.47 million. This sum is very close to the sum of the values shown in the above table data, which is $40,791.6 million.
Chapter 8 Solutions
PRECALCULUS W/LIMITS:GRAPH.APPROACH(HS)


- Please as many detarrow_forward8–23. Sketching vector fields Sketch the following vector fieldsarrow_forward25-30. Normal and tangential components For the vector field F and curve C, complete the following: a. Determine the points (if any) along the curve C at which the vector field F is tangent to C. b. Determine the points (if any) along the curve C at which the vector field F is normal to C. c. Sketch C and a few representative vectors of F on C. 25. F = (2½³, 0); c = {(x, y); y − x² = 1} 26. F = x (23 - 212) ; C = {(x, y); y = x² = 1}) , 2 27. F(x, y); C = {(x, y): x² + y² = 4} 28. F = (y, x); C = {(x, y): x² + y² = 1} 29. F = (x, y); C = 30. F = (y, x); C = {(x, y): x = 1} {(x, y): x² + y² = 1}arrow_forward
- ٣/١ B msl kd 180 Ka, Sin (1) I sin () sin(30) Sin (30) اذا ميريد شرح الكتب بس 0 بالفراغ 3) Cos (30) 0.866 4) Rotating 5) Synchronous speed, 120 x 50 G 5005 1000 s = 1000-950 Copper bosses 5kW Rotor input 5 0.05 : loo kw 6) 1 /0001 ined sove in peaper I need a detailed solution on paper please وه اذا ميريد شرح الكتب فقط ١٥٠ DC 7) rotor a ' (y+xlny + xe*)dx + (xsiny + xlnx + dy = 0. Q1// Find the solution of: ( 357arrow_forward۳/۱ R₂ = X2 2) slots per pole per phase 3/31 B. 180 msl Kas Sin (I) 1sin() sin(30) Sin (30) اذا ميريد شرح الكتب بس 0 بالفراغ 3) Cos (30): 0.866 4) Rotating 5) Synchronous speeds 120×50 looo G 1000-950 1000 Copper losses 5kw Rotor input 5 loo kw 0.05 6) 1 اذا ميريد شرح الكتب فقط look 7) rotor DC ined sove in peaper I need a detailed solution on paper please 0 64 Find the general solution of the following equations: QI//y(4)-16y= 0. Find the general solution of the following equations: Q2ll yll-4y/ +13y=esinx.arrow_forwardR₂ = X2 2) slots per pole per phase = 3/31 B-180 60 msl kd Kas Sin () 2 I sin (6) sin(30) Sin (30) اذا مريد شرح الكتب بس 0 بالفراغ 3 Cos (30) 0.866 4) Rotating ined sove in peaper 5) Synchronous speed s 120×50 6 s = 1000-950 1000 Copper losses 5kw Rotor input 5 0.05 6) 1 loo kw اذا ميريد شرح الكتب فقط Look 7) rotov DC I need a detailed solution on paper please 0 64 Solve the following equations: 0 Q1// Find the solution of: ( y • with y(0) = 1. dx x²+y²arrow_forward
- R₂ = X2 2) slots per pole per phase = 3/3 1 B-180-60 msl Ka Sin (1) Isin () sin(30) Sin (30) اذا ميريد شرح الكتب بس 0 بالفراغ 3) Cos (30) 0.866 4) Rotating 5) Synchronous speed, 120 x 50 s = 1000-950 1000 Copper losses 5kw Rotor input 5 6) 1 0.05 G 50105 loo kw اذا ميريد شرح الكتب فقط look 7) rotov DC ined sove in peaper I need a detailed solution on paper please 064 2- A hot ball (D=15 cm ) is cooled by forced air T.-30°C, the rate of heat transfer from the ball is 460.86 W. Take for the air -0.025 Wim °C and Nu=144.89, find the ball surface temperature a) 300 °C 16 b) 327 °C c) 376 °C d) None か = 750 01arrow_forwardDon't do 14. Please solve 19arrow_forwardPlease solve 14 and 15arrow_forward
- 1. Consider the following system of equations: x13x2 + 4x3 - 5x4 = 7 -2x13x2 + x3 - 6x4 = 7 x16x213x3 - 21x4 = 28 a) Solve the system. Write your solution in parametric and vector form. b) What is a geometric description of the solution. 7 c) Is v = 7 in the span of the set S= [28. 1 HE 3 -5 3 ·6 ? If it is, write v 6 as a linear combination of the vectors in S. Justify. d) How many solutions are there to the associated homogeneous system for the system above? Justify. e) Let A be the coefficient matrix from the system above. Find the set of all solutions to Ax = 0. f) Is there a solution to Ax=b for all b in R³? Justify.arrow_forward4. Suppose that A is made up of 5 column vectors in R³, and suppose that the rank(A)=3. a. How many solutions are there to Ax=0? Justify. b. What is a geometric description for the nullspace(A)? Justify. c. Do the column vectors of A span R³? Justify. d. Is A invertible? Justify.arrow_forward3. Suppose that A is 5 x 5 and rank(A)=4. Use this information to answer the following. a. Give a geometric description of nullspace(A). Justify. b. Is A invertible? Justify. c. Give a geometric description of the span of the column vectors of A. What space are the column vectors of A in? Justify. d. What is determinant of A? Justify.arrow_forward
 Calculus: Early TranscendentalsCalculusISBN:9781285741550Author:James StewartPublisher:Cengage Learning
 Thomas' Calculus (14th Edition)CalculusISBN:9780134438986Author:Joel R. Hass, Christopher E. Heil, Maurice D. WeirPublisher:PEARSON
 Calculus: Early Transcendentals (3rd Edition)CalculusISBN:9780134763644Author:William L. Briggs, Lyle Cochran, Bernard Gillett, Eric SchulzPublisher:PEARSON
 Calculus: Early TranscendentalsCalculusISBN:9781319050740Author:Jon Rogawski, Colin Adams, Robert FranzosaPublisher:W. H. Freeman
 Calculus: Early Transcendental FunctionsCalculusISBN:9781337552516Author:Ron Larson, Bruce H. EdwardsPublisher:Cengage Learning