
Videos
Preliminary data analyses indicate that you can reasonably apply the z-interval procedure (Procedure 8.1 on page 339) in Exercises 8.69–8.74.
8.69 Venture-Capital Investments. Data on investments in the high-tech industry by venture capitalists are compiled by VentureOneCorporation and published in America’s Network Telecom Investor Supplement. A random sample of 18 venture-capital investments in the fiber optics business sector yielded the following data, in millions of dollars.
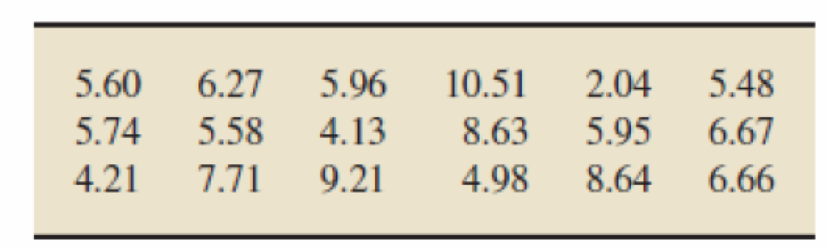
Determine and interpret a 95% confidence interval for the
Want to see the full answer?
Check out a sample textbook solution
Chapter 8 Solutions
Introductory Statistics (10th Edition)


- Percent 13 A car dealer specializing in minivan sales saibe conducts a survey to find out more about who its customers are. One of the variables at the company measures is gender; the results of this part of the survey are shown in the following bar graph. pow a. Interpret these results. b. Explain whether you think the bar graph is a fair and accurate representation of this data. 70 Gender of Customers 60 50 40 30 20 10 0 Males Femalesarrow_forwardThree cat- ency bar 10 Suppose that a health club asks 30 customers ad to rate the services as very good (1), good (2), fair (3), or poor (4). You can see the results in the following bar graph. What percentage of the customers rated the services as good? n; 2: pinion). of this to make a eople in ng ban?) Health Club Customer Ratings (1-very good,..., 4-poor) Frequency 10 8 00 6 11 A polling orga what voters t random samp for their opin no opinion. following ba a. Make a (includ bob. Evalua fairly tral 2 0 1 -2 3 4 540 480 420 360 300 240 Frequencyarrow_forward1 - Multiple Regression Equations and Predictions with XLMiner Analysis ToolPak (Structured) Video The owner of Showtime Movie Theaters, Inc., would like to predict weekly gross revenue as a function of advertising expenditures. Historical data for a sample of eight weeks are entered into the Microsoft Excel Online file below. Use the XLMiner Analysis ToolPak to perform your regression analysis in the designated areas of the spreadsheet. Due to a recent change by Microsoft you will need to open the XLMiner Analysis ToolPak add-in manually from the home ribbon. Screenshot of ToolPak X Open spreadsheet a. Develop an estimated regression equation with the amount of television advertising as the independent variable (to 2 decimals). JAN 27 Revenue = × TVAdv + b. Develop an estimated regression equation with both television advertising and newspaper advertising as the independent variables (to 2 decimals). Revenue = + TVAdy + NewsAdv c. Is the estimated regression equation coefficient for…arrow_forward
- Question 2: When John started his first job, his first end-of-year salary was $82,500. In the following years, he received salary raises as shown in the following table. Fill the Table: Fill the following table showing his end-of-year salary for each year. I have already provided the end-of-year salaries for the first three years. Calculate the end-of-year salaries for the remaining years using Excel. (If you Excel answer for the top 3 cells is not the same as the one in the following table, your formula / approach is incorrect) (2 points) Geometric Mean of Salary Raises: Calculate the geometric mean of the salary raises using the percentage figures provided in the second column named “% Raise”. (The geometric mean for this calculation should be nearly identical to the arithmetic mean. If your answer deviates significantly from the mean, it's likely incorrect. 2 points) Hint for the first part of question 2: To assist you with filling out the table in the first part of the question,…arrow_forwardConsider a sample with data values of 27, 25, 20, 15, 30, 34, 28, and 25. Compute the range, interquartile range, variance, and standard deviation (to a maximum of 2 decimals, if decimals are necessary). Range Interquartile range Variance Standard deviationarrow_forwardPerform a Step by step following tests in Microsoft Excel. Each of the following is 0.5 points, with a total of 6 points. Provide your answers in the following table. Median Standard Deviation Minimum Maximum Range 1st Quartile 2nd Quartile 3rd Quartile Skewness; provide a one sentence explanation of what does the skewness value indicates Kurtosis; provide a one sentence explanation of what does the kurtosis value indicates Make a labelled histogram; no point awarded if it is not labelled Make a labelled boxplot; no point awarded if it is not labelled Data 27 30 22 25 24 22 20 28 20 26 21 23 24 20 28 30 20 28 29 30 21 26 29 25 26 25 20 30 26 28 25 21 22 27 27 24 26 22 29 28 30 22 22 22 30 21 21 30 26 20arrow_forward
- Obtain the linear equation for trend for time series with St² = 140, Ey = 16.91 and Σty= 62.02, m n = 7arrow_forwardA quality characteristic of a product is normally distributed with mean μ and standard deviation σ = 1. Speci- fications on the characteristic are 6≤x≤8. A unit that falls within specifications on this quality characteristic results in a profit of Co. However, if x 8, the profit is -C2. Find the value ofμ that maximizes the expected profit.arrow_forwardA) The output voltage of a power supply is normally distributed with mean 5 V and standard deviation 0.02 V. If the lower and upper specifications for voltage are 4.95 V and 5.05 V, respectively, what is the probability that a power supply selected at random conform to the specifications on voltage? B) Continuation of A. Reconsider the power supply manufacturing process in A. Suppose We wanted to improve the process. Can shifting the mean reduce the number of nonconforming units produced? How much would the process variability need to be reduced in order to have all but one out of 1000 units conform to the specifications?arrow_forward
- der to complete the Case X T Civil Service Numerical Test Sec X T Casework Skills Practice Test Maseline Vaseline x + euauthoring.panpowered.com/DeliveryWeb/Civil Service Main/84589a48-6934-4b6e-a6e1-a5d75f559df9?transferToken-News NGSSON The table below shows the best price available for various items from 4 uniform suppliers. The prices do not include VAT (charged at 20%). Item Waterproof boots A1-Uniforms (£)Best Trade (£)Clothing Tech (£)Dress Right (£) 59.99 39.99 59.99 49.99 Trousers 9.89 9.98 9.99 11.99 Shirts 14.99 15.99 16.99 12.99 Hi-Vis vest 4.49 4.50 4.00 4.00 20.00 25.00 19.50 19.99 Hard hats A company needs to buy a set of 12 uniforms which includes 1 of each item. If the special offers are included which supplier is cheapest? OOO A1-Uniforms Best Trade Clothing Tech Q Search + ** 109 8 CO* F10 Home F11 F12 6arrow_forwardto complete the Case × T Civil Service Numerical Test Sec x T Casework Skills Practice Test + Vaseline euauthoring.panpowered.com/DeliveryWeb/Civil Service Main/84589a48-b934-4b6e-a6e1-a5d75f559df9?transferToken=MxNewOS NGFSPSZSMOMzuz The table below shows the best price available for various items from 4 uniform suppliers. The prices do not include VAT (charged at 20%). Item A1-Uniforms (£)Best Trade (£)Clothing Tech (£)Dress Right (£) Waterproof boots 59.99 39.99 59.99 49.99 Trousers 9.89 9.98 9.99 11.99 Shirts 14.99 15.99 16.99 12.99 Hi-Vis vest 4.49 4.50 4.00 4.00 20.00 25.00 19.50 19.99 Hard hats A company needs to buy a set of 12 uniforms which includes 1 of each item. If the special offers are included, which supplier is cheapest? O O O O A1-Uniforms Best Trade Clothing Tech Dress Right Q Search ENG L UK +0 F6 四吧 6 78 ㄓ F10 9% * CO 1 F12 34 Oarrow_forwardCritics review films out of 5 based on three attributes: the story, the special effects and the acting. The ratings of four critics for a film are collected in the table below.CriticSpecialStory rating Effects rating Acting rating Critic 14.44.34.5Critic 24.14.23.9Critic 33.943.4Critic 44.24.14.2Critic 1 also gave the film a rating for the Director's ability. If the average of Critic 1's ratings was 4.3 what rating did they give to the Director's ability?3.94.04.14.24.3arrow_forward
 Big Ideas Math A Bridge To Success Algebra 1: Stu...AlgebraISBN:9781680331141Author:HOUGHTON MIFFLIN HARCOURTPublisher:Houghton Mifflin Harcourt