Preliminary data analyses indicate that you can reasonably apply the z-interval procedure (Procedure 8.1 on page 339) in Exercises 8.69–8.74.
8.70 Poverty and Dietary Calcium. Calcium is the most abundant mineral in the human body and has several important
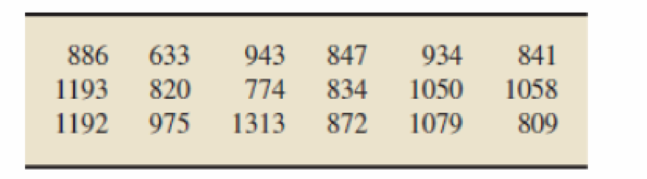
Determine and interpret a 95% confidence interval for the
Want to see the full answer?
Check out a sample textbook solutionChapter 8 Solutions
Introductory Statistics (10th Edition)
- Peoples of the Democratic Republic of the Congo In spite of the devastation of the Great African War (1995 – 2007, analyzed in learning activity four of this unit) that caused the death of an estimated seven million Congolese, the DRC remains the fourth most populated country in Africa with a population of 79.4 million (2015), following Nigeria, Ethiopia and Egypt. The DRC’s population is currently growing at 2.7 percent annually. Not unlike most African countries, the population of the DRC is heavily skewed to youth: 44% of the national population is under 24 years of age! Compare this to 32% of the population for the same age group in the U.S. and 24% in Japan. This demographic reality makes great demands on the government and economy of the DRC in terms of providing schooling (and other social services) and opportunities for employment in an economy decimated by war, mismanagement, and the on-going legacy of the exploitation of the DRC’s natural resources by international…arrow_forwardEarly life corresponds to the first bacterial colonization of the digestive tract, creating a microbiome thought to play an important role in human development. What might be the effect of early exposure to antibiotics on children's development? One study followed 11,532 full-term babies all born in the county of Avon, United Kingdom, during 1991 and 1992. Exposures to antibiotics during infancy were recorded, along with measures of body mass at regular intervals over several years. The researchers found that antibiotic exposure during the first six months of life was associated with increased body mass later in childhood.arrow_forwardplease show diagram of p valuearrow_forward
- (a) For United States, provide data for the variables below over the years 1993 –2007:(i) Net migration rate (per 1,000 population)(ii) Total fertility rate (live births per woman)(iii)Unemployment, general level (Thousands)(iv) Wages(v) Life expectancy at birth for both sexes combined (years)Data can be obtained from the UN database http://data.un.org/Explorer.aspxUsing R-Studio, estimate a regression equation to determine the effect of unemployment,general level, wages and life expectancy at birth for both sexes on the net migration rate.(All codes and regression output should be provided).(i) Write down the regression equation. (ii) Interpret the coefficients and determine which of the individual coefficients in theregression model are statistically significant. In responding, construct and test anyappropriate hypothesis. (iii) Interpret the coefficient of determination.arrow_forwardThe question that I need help with is attached. thanksarrow_forwardThe euphotic zone is the upper 200 m layer of the oceans. Very little sunlight penetrates deeper than 200 m, so most plants live in the euphotic zone. As a result, 70% of all photosynthesis on Earth occurs in the euphotic zone of the oceans. The following table gives light penetration data for the location in the Pacific Ocean. Depth (m) Penetration of Sunlight (%) 0.01 100 20 54.37 40 29.57 60 16.08 80 8.74 100 4.76 a. Determine the equation of the logarithmic regression by using LOG or LN function on your TI-83 Plus graphic calculator. b. Using your equation obtained from a), determine the depth with a sunlight penetration of 35%. Express your answer to the nearest tenth of meter.arrow_forward
- can someone use minitab for this questionarrow_forward(a) For United States, provide data for the variables below over the years 1993 – 2007: (i) Net migration rate (per 1,000 population) (ii) Total fertility rate (live births per woman) (iii)Unemployment, general level (Thousands) (iv) Wages (v) Life expectancy at birth for both sexes combined (years) Data can be obtained from the UN database http://data.un.org/Explorer.aspx Using R-Studio, estimate a regression equation to determine the effect of unemployment, general level, wages and life expectancy at birth for both sexes on the net migration rate. (All codes and regression output should be provided). (iv) Using the 10% level of significance, determine and discuss whether the overall regression equation is statistically significant. In responding, construct and test any appropriate hypothesis. (v) Determine and interpret the confidence interval for the independent variable(s).arrow_forward(a) For United States, provide data for the variables below over the years 1993 – 2007: (i) Net migration rate (per 1,000 population) (ii) Total fertility rate (live births per woman) (iii)Unemployment, general level (Thousands) (iv) Wages (v) Life expectancy at birth for both sexes combined (years) Data can be obtained from the UN database http://data.un.org/Explorer.aspx Using R-Studio, estimate a regression equation to determine the effect of unemployment, general level, wages and life expectancy at birth for both sexes on the net migration rate. (All codes and regression output should be provided).(b) Using R-Studio redo the regression analysis with the total fertility rate as an additionalindependent variable. (All codes and regression output should be provided).(i) Write down the regression equation. (ii) Use the 5% level of significance, determine and discuss whether the total fertilityrate has a significant impact on the net migration rate in your assigned country.…arrow_forward
- Researchers collected data to examine the relationship between pollutants and preterm births in Southern California. During the study air pollution levels were measured by air quality monitoring stations. Specifically, levels of carbon monoxide were recorded in parts per million, nitrogen dioxide and ozone in parts per hundred million, and coarse particulate matter PM10 in µg/m3. Length of gestation data were collected on 143,196 births between the years 1989 and 1993, and air pollution exposure during gestation was calculated for each birth. The analysis suggested that increased ambient PM10 and, to a lesser degree, CO concentrations may be associated with the occurrence of preterm births. a. The paragraph above describes an O A. Observational Study B. Experiment b. The cases in this research are OA. Air pollution exposure during gestation B. Each birth between 1989 and 1993 C. Each type of pollution measured by air quality monitoring stations D. Each year between 1989 and 1993 c.…arrow_forwardShow complete solution and explain the steps in answering.arrow_forwardChapter 3, Section 1, Exercise 001 State whether the quantity described is a parameter or a statistic and give the correct notation.Average household income for all houses in the US, using data from the US Census.arrow_forward
- Linear Algebra: A Modern IntroductionAlgebraISBN:9781285463247Author:David PoolePublisher:Cengage Learning