
Concept explainers
Videos
Interpretation:
The pH values after the addition of each proportion of the base to the acid is to be determined. Also, the titration curve needs to be drawn.
Concept introduction:
Titration curve is drawn to determine the change in pH of an acid or base with respect to the added volume of base or acid to it.
The titration curve can be drawn between a strong/weak acid and strong/weak base. The change in pH shows different patterns for different combinations of acids and bases.
Explanation of Solution
Initial pH of the analyte solution can be determined as follows:
Propanoic acid is a weak acid that forms equilibrium when dissolved in water. The equilibrium is as follows.
The amount of acid at the beginning
| Reaction | Proanoic acid | Propanoate ion | OH- |
| Initial | 0.1 | 0 | 0 |
| Change | -x | +x | +x |
| Equilibrium | (0.1-x) | x | x |
The acid dissociation constant can be represented as follows:
Solving this quadratic equation gives the amount of hydrogen ions in the solution.
On solving the only possible value of x is
Now, pH can be calculated as follows:
Addition of
Total amount of acid to be neutralized
Amount of base added
Then the ICE table after the addition of base is created in order to determine the pH of the solution using Henderson-Hasselbalch equation.
| Reaction | Propanoic acid | OH- | Propanoate ion | H+ |
| Initial | 0.0025 | 0 | 0 | 0 |
| Add | 0 | 0.0004 | ||
| Change | -0.0004 | -0.0004 | 0.0004 | 0.0004 |
| Equilibrium | 0.0021 | 0 | 0.0004 | 0.0004 |
Concentration of base after addition of acid
Concentration of ammonium ion
In the Henderson-Hasselbalch equation, the pKa is used.
Applying the Henderson-Hasselbalch equation,
Addition of
Total amount of acid to be neutralized
Amount of base added
Then the ICE table after the addition of base is created in order to determine the pH of the solution using Henderson-Hasselbalch equation.
| Reaction | Propanoic acid | OH- | Propanoate ion | H+ |
| Initial | 0.0025 | 0 | 0 | 0 |
| Add | 0 | 0.0008 | ||
| Change | -0.0008 | -0.0008 | 0.0008 | 0.0008 |
| Equilibrium | 0.0017 | 0 | 0.0008 | 0.0008 |
Concentration of acid after addition of base
Concentration of propanoate ion
Applying the Henderson-Hasselbalch equation,
Addition of
Total amount of acid to be neutralized
Amount of base added
Then the ICE table after the addition of base is created in order to determine the pH of the solution using Henderson-Hasselbalch equation.
| Reaction | Propanoic acid | OH- | Propanoate ion | H+ |
| Initial | 0.0025 | 0 | 0 | 0 |
| Add | 0 | 0.00125 | ||
| Change | -0.00125 | -0.00125 | 0.00125 | 0.00125 |
| Equilibrium | 0.00125 | 0 | 0.00125 | 0.00125 |
Concentration of acid after addition of base
Concentration of propanoate ion
Applying the Henderson-Hasselbalch equation,
Addition of
Total amount of acid to be neutralized
Amount of base added
Then the ICE table after the addition of base is created in order to determine the pH of the solution using Henderson-Hasselbalch equation.
| Reaction | Propanoic acid | H+ | Propanoate ion | OH- |
| Initial | 0.0025 | 0 | 0 | 0 |
| Add | 0 | 0.002 | ||
| Change | -0.002 | -0.002 | 0.002 | 0.002 |
| Equilibrium | 0.0005 | 0 | 0.002 | 0.002 |
Concentration of acid after addition of base
Concentration of propanoate ion
Applying the Henderson-Hasselbalch equation,
Addition of
Total amount of acid to be neutralized
Amount of base added
Then the ICE table after the addition of base is created in order to determine the pH of the solution using Henderson-Hasselbalch equation.
| Reaction | Propanoic | OH- | Propanoate | H+ |
| Initial | 0.0025 | 0 | 0 | 0 |
| Add | 0 | 0.0024 | ||
| Change | -0.0024 | -0.0024 | 0.0024 | 0.0024 |
| Equilibrium | 0.0001 | 0 | 0.0024 | 0.0024 |
Concentration of acid after addition of base
Concentration of propanoate ion
Applying the Henderson-Hasselbalch equation,
Addition of
Total amount of acid to be neutralized
Amount of base added
Then the ICE table after the addition of base is created in order to determine the pH of the solution using Henderson-Hasselbalch equation.
| Reaction | Propanoic | OH- | Propanoate | H+ |
| Initial | 0.0025 | 0 | 0 | 0 |
| Add | 0 | 0.00245 | ||
| Change | -0.00245 | -0.00245 | -0.00245 | -0.00245 |
| Equilibrium | 0.00005 | 0 | -0.00245 | -0.00245 |
Concentration of acid after addition of base
Concentration of propanoate ion
Applying the Henderson-Hasselbalch equation,
Addition of
Total amount of acid to be neutralized
Amount of base added
Then the ICE table after the addition of base is created in order to determine the pH of the solution using Henderson-Hasselbalch equation.
| Reaction | Propanoic | OH- | Propanoate | H+ |
| Initial | 0.0025 | 0 | 0 | 0 |
| Add | 0 | 0.00249 | ||
| Change | -0.00249 | -0.00249 | -0.00249 | -0.00249 |
| Equilibrium | 0.00001 | 0 | -0.00249 | -0.00249 |
Concentration of acid after addition of base
Concentration of propanoate ion
Applying the Henderson-Hasselbalch equation,
Addition of
Total amount of acid to be neutralized
Amount of base added
Then the ICE table after the addition of base is created in order to determine the pH of the solution using Henderson-Hasselbalch equation.
| Reaction | Propanoic | OH- | Propanoate | H+ |
| Initial | 0.0025 | 0 | 0 | 0 |
| Add | 0 | 0.0025 | ||
| Change | -0.0025 | -0.0025 | -0.0025 | -0.0025 |
| Equilibrium | 0.0000 | 0 | -0.0025 | -0.0025 |
Concentration of acid after addition of base
Concentration of propanoate ion
At this point, there is no excess acid or base. Therefore, the only possible reaction here is the dissociation of the conjugate acid of the propanoic acid (that is propanoate ion).
Thereafter, using the Kb value for propanoate ion, the amount of hydrogen ions in the solution can be determined to get the pH value at this point.
| Reaction | Propanoate ion | Propanoic acid | OH- |
| Initial | 0.05 | 0 | 0 |
| Change | -X | +x | +x |
| Equilibrium | (0.05-x) | x | x |
Then the pH can be calculated as follows:
On solving the equation, the only possible value of x will be:
This is the concentration of hydroxide ion. The pOH value can be calculated as follows:
Thus, pH of the solution is
Addition of
Total amount of acid to be neutralized
Amount of base added
Then the ICE table after the addition of base is created in order to determine the pH of the solution using Henderson-Hasselbalch equation.
| Reaction | Propanoic | OH- | Propanoate | H+ |
| Initial | 0.0025 | 0 | 0 | 0 |
| Add | 0 | 0.0028 | ||
| Change | -0.0025 | 0.0025 | 0 | 0 |
| Equilibrium | 0 | 0.0003 | 0 | 0 |
Concentration of hydroxide ion
Addition of
Total amount of acid to be neutralized
Amount of base added
Then the ICE table after the addition of base is created in order to determine the pH of the solution using Henderson-Hasselbalch equation.
| Reaction | Propanoic | OH- | Propanoate | H+ |
| Initial | 0.0025 | 0 | 0 | 0 |
| Add | 0 | 0.0030 | ||
| Change | -0.0025 | 0.0025 | 0 | 0 |
| Equilibrium | 0 | 0.0005 | 0 | 0 |
Concentration of hydroxide ion
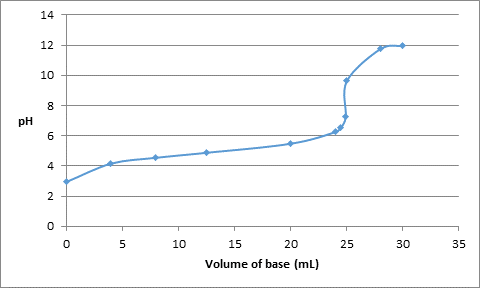
Thus, the pH values for volume of base added are as follows:
| Volume of base added (mL) | pH |
| 0.0 | 2.94 |
| 4.0 | 4.16 |
| 8.0 | 4.55 |
| 12.5 | 4.88 |
| 20.0 | 5.48 |
| 24.0 | 6.26 |
| 24.5 | 6.57 |
| 24.9 | 7.26 |
| 25.0 | 9.64 |
| 28.0 | 11.75 |
| 30.0 | 11.96 |
The titration curve can be drawn as follows:
Want to see more full solutions like this?
Chapter 8 Solutions
EBK CHEMICAL PRINCIPLES


- Nonearrow_forward4. Draw and label all possible isomers for [M(py)3(DMSO)2(CI)] (py = pyridine, DMSO dimethylsulfoxide).arrow_forwardThe emission data in cps displayed in Table 1 is reported to two decimal places by the chemist. However, the instrument output is shown in Table 2. Table 2. Iron emission from ICP-AES Sample Blank Standard Emission, cps 579.503252562 9308340.13122 Unknown Sample 343.232365741 Did the chemist make the correct choice in how they choose to display the data up in Table 1? Choose the best explanation from the choices below. No. Since the instrument calculates 12 digits for all values, they should all be kept and not truncated. Doing so would eliminate significant information. No. Since the instrument calculates 5 decimal places for the standard, all of the values should be limited to the same number. The other decimal places are not significant for the blank and unknown sample. Yes. The way Saman made the standards was limited by the 250-mL volumetric flask. This glassware can report values to 2 decimal places, and this establishes our number of significant figures. Yes. Instrumental data…arrow_forward
- 7. Draw a curved arrow mechanism for the following reaction. HO cat. HCI OH in dioxane with 4A molecular sievesarrow_forwardTry: Convert the given 3D perspective structure to Newman projection about C2 - C3 bond (C2 carbon in the front). Also, show Newman projection of other possible staggered conformers and circle the most stable conformation. Use the template shown. F H3C Br Harrow_forwardNonearrow_forward
 Chemistry & Chemical ReactivityChemistryISBN:9781337399074Author:John C. Kotz, Paul M. Treichel, John Townsend, David TreichelPublisher:Cengage Learning
 Chemistry & Chemical ReactivityChemistryISBN:9781133949640Author:John C. Kotz, Paul M. Treichel, John Townsend, David TreichelPublisher:Cengage Learning
 Chemistry: Principles and PracticeChemistryISBN:9780534420123Author:Daniel L. Reger, Scott R. Goode, David W. Ball, Edward MercerPublisher:Cengage Learning
 Chemistry: Principles and ReactionsChemistryISBN:9781305079373Author:William L. Masterton, Cecile N. HurleyPublisher:Cengage Learning
 General Chemistry - Standalone book (MindTap Cour...ChemistryISBN:9781305580343Author:Steven D. Gammon, Ebbing, Darrell Ebbing, Steven D., Darrell; Gammon, Darrell Ebbing; Steven D. Gammon, Darrell D.; Gammon, Ebbing; Steven D. Gammon; DarrellPublisher:Cengage Learning
 General, Organic, and Biological ChemistryChemistryISBN:9781285853918Author:H. Stephen StokerPublisher:Cengage Learning