
Concept explainers
Videos
Interpretation:
The pH values after the addition of each proportion of the base to the acid is to be determined. Also, the titration curve needs to be drawn.
Concept introduction:
Titration curve is drawn to determine the change in pH of an acid or base with respect to the added volume of base or acid to it.
The titration curve can be drawn between a strong/weak acid and strong/weak base. The change in pH shows different patterns for different combinations of acids and bases.
Explanation of Solution
Initial pH of the analyte solution can be calculated as follows:
Lactic acid is a weak acid that forms an equilibrium mixture when dissolved in water. The equilibrium is as follows.
The initial molarity of lactic acid is 0.1 M.
The amount of lactic acid at the beginning can be calculated from. By constructing an ICE table, the concentration of lactate ion in the solution after the acid dissociation can be determined.
| Reaction | Lactic acid | Lactate | H+ |
| Initial | 0.1 | 0 | 0 |
| Change | -x | +x | +x |
| Equilibrium | (0.1-x) | x | x |
The acid dissociation constant can be represented as follows:
Solving this quadratic equation gives the amount of hydrogen ions in the solution.
Thus, the concentration of hydrogen ion is 0.00185 and pH of the solution can be calculated as follows:
Addition of
Total amount of lactic acid to be neutralized can be calculated from its molarity and volume as follows:
Or,
Now, the amount of base added can be calculated as follows:
Then the ICE table after the addition of base is created in order to determine the pH of the solution using Henderson-Hasselbalch equation.
| Reaction | Lactic acid | OH- | Lactate | H+ |
| Initial | 0.0025 | 0 | 0 | 0 |
| Add | 0 | 0.0004 | ||
| Change | -0.0004 | -0.0004 | 0.0004 | 0.0004 |
| Equilibrium | 0.0021 | 0 | 0.0004 | 0.0004 |
Concentration of lactic acid after addition of base
Concentration of lactate ion
Applying the Henderson-Hasselbalch equation,
Addition of
Total amount of lactic acid to be neutralized
Amount of base added
Then the ICE table after the addition of base is created in order to determine the pH of the solution using Henderson-Hasselbalch equation.
| Reaction | Lactic acid | OH- | Lactate | H+ |
| Initial | 0.0025 | 0 | 0 | 0 |
| Add | 0 | 0.0008 | ||
| Change | -0.0008 | -0.0008 | 0.0008 | 0.0008 |
| Equilibrium | 0.0017 | 0 | 0.0008 | 0.0008 |
Concentration of lactic acid after addition of base
Concentration of lactate ion
Applying the Henderson-Hasselbalch equation,
Addition of
Total amount of lactic acid to be neutralized
Amount of base added
Then the ICE table after the addition of base is created in order to determine the pH of the solution using Henderson-Hasselbalch equation.
| Reaction | Lactic acid | OH- | Lactate | H+ |
| Initial | 0.0025 | 0 | 0 | 0 |
| Add | 0 | 0.00125 | ||
| Change | -0.00125 | -0.00125 | 0.00125 | 0.00125 |
| Equilibrium | 0.00125 | 0 | 0.00125 | 0.00125 |
Concentration of lactic acid after addition of base
Concentration of lactate ion
Applying the Henderson-Hasselbalch equation,
Addition of
Total amount of lactic acid to be neutralized
Amount of base added
Then the ICE table after the addition of base is created in order to determine the pH of the solution using Henderson-Hasselbalch equation.
| Reaction | Lactic acid | OH- | Lactate | H+ |
| Initial | 0.0025 | 0 | 0 | 0 |
| Add | 0 | 0.002 | ||
| Change | -0.002 | -0.002 | 0.002 | 0.002 |
| Equilibrium | 0.0005 | 0 | 0.002 | 0.002 |
Concentration of lactic acid after addition of base
Concentration of lactate ion
Applying the Henderson-Hasselbalch equation,
Addition of
Total amount of lactic acid to be neutralized
Amount of base added
Then the ICE table after the addition of base is created in order to determine the pH of the solution using Henderson-Hasselbalch equation.
| Reaction | Lactic acid | OH- | Lactate | H+ |
| Initial | 0.0025 | 0 | 0 | 0 |
| Add | 0 | 0.0024 | ||
| Change | -0.0024 | -0.0024 | 0.0024 | 0.0024 |
| Equilibrium | 0.0001 | 0 | 0.0024 | 0.0024 |
Concentration of lactic acid after addition of base
Concentration of lactate ion
Applying the Henderson-Hasselbalch equation,
Addition of
Total amount of lactic acid to be neutralized
Amount of base added
Then the ICE table after the addition of base is created in order to determine the pH of the solution using Henderson-Hasselbalch equation.
| Reaction | Lactic acid | OH- | Lactate | H+ |
| Initial | 0.0025 | 0 | 0 | 0 |
| Add | 0 | 0.00245 | ||
| Change | -0.00245 | -0.00245 | -0.00245 | -0.00245 |
| Equilibrium | 0.00005 | 0 | -0.00245 | -0.00245 |
Concentration of lactic acid after addition of base
Concentration of lactate ion
Applying the Henderson-Hasselbalch equation,
Addition of
Total amount of lactic acid to be neutralized
Amount of base added
Then the ICE table after the addition of base is created in order to determine the pH of the solution using Henderson-Hasselbalch equation.
| Reaction | Lactic acid | OH- | Lactate | H+ |
| Initial | 0.0025 | 0 | 0 | 0 |
| Add | 0 | 0.00249 | ||
| Change | -0.00249 | -0.00249 | -0.00249 | -0.00249 |
| Equilibrium | 0.00001 | 0 | -0.00249 | -0.00249 |
Concentration of lactic acid after addition of base
Concentration of lactate ion
Applying the Henderson-Hasselbalch equation,
Addition of
Total amount of lactic acid to be neutralized
Amount of base added
Then the ICE table after the addition of base is created in order to determine the pH of the solution using Henderson-Hasselbalch equation.
| Reaction | Lactic acid | OH- | Lactate | H+ |
| Initial | 0.0025 | 0 | 0 | 0 |
| Add | 0 | 0.0025 | ||
| Change | -0.0025 | -0.0025 | -0.0025 | -0.0025 |
| Equilibrium | 0.0000 | 0 | -0.0025 | -0.0025 |
Concentration of lactic acid after addition of base
Concentration of lactate ion
At this point, there is no excess acid or base. Therefore, the only possible reaction here is the dissociation of the conjugate base of the lactic acid (that is lactate ion).
Thereafter, by obtaining the Kb value for lactate ion, the amount of hydroxide ions in the solution can be determined to get the pH value at this point.
| Reaction | Lactic acid | Lactate | OH- |
| Initial | 0.05 | 0 | 0 |
| Change | -X | x | x |
| Equilibrium | (0.05-x) | x | x |
Then the pH can be calculated as follows:
Thereafter, this quadratic equation can be solved to determine the hydroxide ion concentration, thereby, the pOH and the pH can be determined.
The calculated value of x is concentration of hydroxide ion. The pOH of the solution will be:
Addition of
Total amount of lactic acid to be neutralized
Amount of base added
Then the ICE table after the addition of base is created in order to determine the pH of the solution using Henderson-Hasselbalch equation.
| Reaction | Lactic acid | OH- | Lactate | H+ |
| Initial | 0.0025 | 0 | 0 | 0 |
| Add | 0 | 0.0028 | ||
| Change | -0.0025 | 0.0025 | 0 | 0 |
| Equilibrium | 0 | 0.0003 | 0 | 0 |
Concentration of hydroxide
Addition of
Total amount of lactic acid to be neutralized
Amount of base added
Then the ICE table after the addition of base is created in order to determine the pH of the solution using Henderson-Hasselbalch equation.
| Reaction | Lactic acid | OH- | Lactate | H+ |
| Initial | 0.0025 | 0 | 0 | 0 |
| Add | 0 | 0.0030 | ||
| Change | -0.0025 | 0.0025 | 0 | 0 |
| Equilibrium | 0 | 0.0005 | 0 | 0 |
Concentration of hydroxide
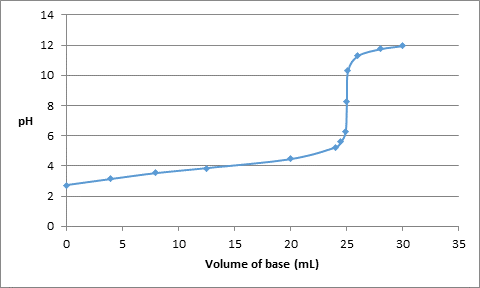
Thus, the value of pH with respect to added volume of base is as follows:
| Volume (in mL) | pH |
| 0 | 2.73 |
| 4 | 3.14 |
| 8 | 3.53 |
| 12.5 | 3.86 |
| 20 | 4.46 |
| 24 | 5.24 |
| 24.5 | 5.6 |
| 24.9 | 6.3 |
| 25.0 | 8.28 |
| 25.1 | 10.3 |
| 26.0 | 11.30 |
| 28.0 | 11.75 |
| 30.0 | 11.96 |
The titration curve can be drawn as follows:
Want to see more full solutions like this?
Chapter 8 Solutions
EBK CHEMICAL PRINCIPLES


- What is the stepwise mechanism for this reaction?arrow_forward32. Consider a two-state system in which the low energy level is 300 J mol 1 and the higher energy level is 800 J mol 1, and the temperature is 300 K. Find the population of each level. Hint: Pay attention to your units. A. What is the partition function for this system? B. What are the populations of each level? Now instead, consider a system with energy levels of 0 J mol C. Now what is the partition function? D. And what are the populations of the two levels? E. Finally, repeat the second calculation at 500 K. and 500 J mol 1 at 300 K. F. What do you notice about the populations as you increase the temperature? At what temperature would you expect the states to have equal populations?arrow_forward30. We will derive the forms of the molecular partition functions for atoms and molecules shortly in class, but the partition function that describes the translational and rotational motion of a homonuclear diatomic molecule is given by Itrans (V,T) = = 2πmkBT h² V grot (T) 4π²IKBT h² Where h is Planck's constant and I is molecular moment of inertia. The overall partition function is qmolec Qtrans qrot. Find the energy, enthalpy, entropy, and Helmholtz free energy for the translational and rotational modes of 1 mole of oxygen molecules and 1 mole of iodine molecules at 50 K and at 300 K and with a volume of 1 m³. Here is some useful data: Moment of inertia: I2 I 7.46 x 10- 45 kg m² 2 O2 I 1.91 x 101 -46 kg m²arrow_forward
- K for each reaction step. Be sure to account for all bond-breaking and bond-making steps. HI HaC Drawing Arrows! H3C OCH3 H 4 59°F Mostly sunny H CH3 HO O CH3 'C' CH3 Select to Add Arrows CH3 1 L H&C. OCH3 H H H H Select to Add Arrows Q Search Problem 30 of 20 H. H3C + :0: H CH3 CH3 20 H2C Undo Reset Done DELLarrow_forwardDraw the principal organic product of the following reaction.arrow_forwardCurved arrows are used to illustrate the flow of electrons. Using the provided structures, draw the curved arrows that epict the mechanistic steps for the proton transfer between a hydronium ion and a pi bond. Draw any missing organic structures in the empty boxes. Be sure to account for all lone-pairs and charges as well as bond-breaking and bond-making steps. 2 56°F Mostly cloudy F1 Drawing Arrows > Q Search F2 F3 F4 ▷11 H. H : CI: H + Undo Reset Done DELLarrow_forward
- Calculate the chemical shifts in 13C and 1H NMR for 4-chloropropiophenone ? Write structure and label hydrogens and carbons. Draw out the benzene ring structure when doing itarrow_forward1) Calculate the longest and shortest wavelengths in the Lyman and Paschen series. 2) Calculate the ionization energy of He* and L2+ ions in their ground states. 3) Calculate the kinetic energy of the electron emitted upon irradiation of a H-atom in ground state by a 50-nm radiation.arrow_forwardCalculate the ionization energy of He+ and Li²+ ions in their ground states. Thannnxxxxx sirrr Ahehehehehejh27278283-4;*; shebehebbw $+$;$-;$-28283773838 hahhehdvaarrow_forward
- Plleeaasseee solllveeee question 3 andd thankss sirr, don't solve it by AI plleeaasseee don't use AIarrow_forwardCalculate the chemical shifts in 13C and 1H NMR for 4-chloropropiophenone ? Write structure and label hydrogens and carbonsarrow_forwardPlease sirrr soollveee these parts pleaseeee and thank youuuuuarrow_forward
 Principles of Modern ChemistryChemistryISBN:9781305079113Author:David W. Oxtoby, H. Pat Gillis, Laurie J. ButlerPublisher:Cengage Learning
 General Chemistry - Standalone book (MindTap Cour...ChemistryISBN:9781305580343Author:Steven D. Gammon, Ebbing, Darrell Ebbing, Steven D., Darrell; Gammon, Darrell Ebbing; Steven D. Gammon, Darrell D.; Gammon, Ebbing; Steven D. Gammon; DarrellPublisher:Cengage Learning
 Chemistry & Chemical ReactivityChemistryISBN:9781133949640Author:John C. Kotz, Paul M. Treichel, John Townsend, David TreichelPublisher:Cengage Learning
 ChemistryChemistryISBN:9781305957404Author:Steven S. Zumdahl, Susan A. Zumdahl, Donald J. DeCostePublisher:Cengage Learning
 Chemistry: An Atoms First ApproachChemistryISBN:9781305079243Author:Steven S. Zumdahl, Susan A. ZumdahlPublisher:Cengage Learning