
Concept explainers
Videos
a.
To make:
A
a.
Answer to Problem 17CT
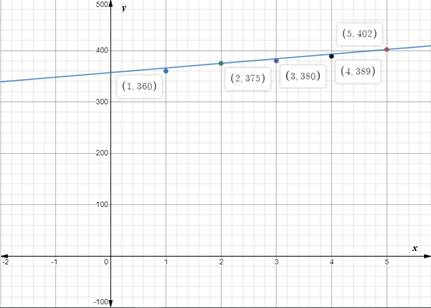
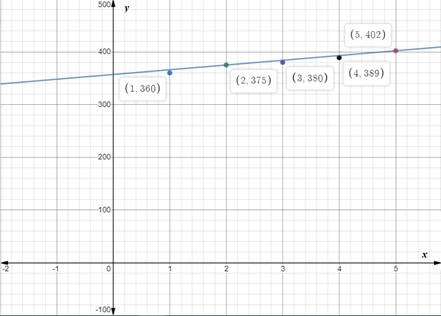
Our required graph would look like:
Explanation of Solution
Given:
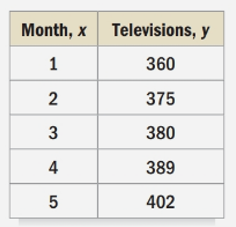
The table shows the number of televisions sold each month at a retail store.
Calculation:
Upon plotting our given data points and drawing a line of best fit, we will get our required graph as shown below:
b.
To write:
An equation of our line in slope-intercept form.
b.
Answer to Problem 17CT
The equation of our line in slope-intercept form would be
Explanation of Solution
Given:
The table shows the number of televisions sold each month at a retail store.

Calculation:
First of all, we will find slope of line passing through points
Now we will substitute slope and coordinates of point
Therefore, the equation of our line in slope-intercept form would be
c.
To predict:
The number of televisions sold at the store during the 7th month.
c.
Answer to Problem 17CT
There were 420 televisions sold at the store during the 7th month.
Explanation of Solution
Given:
The table shows the number of televisions sold each month at a retail store.

Calculation:
To predict the number of televisions sold during 7th month, we will substitute
Therefore, there were 420 televisions sold at the store during the 7th month.
Chapter 8 Solutions
Holt Mcdougal Larson Pre-algebra: Student Edition 2012
Additional Math Textbook Solutions
University Calculus: Early Transcendentals (4th Edition)
Pre-Algebra Student Edition
Elementary Statistics (13th Edition)
A First Course in Probability (10th Edition)
Introductory Statistics
College Algebra with Modeling & Visualization (5th Edition)


- Nasir invested $415 into a savings account that earns 2.5% annual interest. Tiana invested $295 into a saving account that earns 6.8% annual interest. Who will have more money after 7 years? How much more money will the person have?arrow_forwardSolve for the variable. 62k = 7776k- 8arrow_forwardSolve questionsarrow_forward
- Patterns in Floor Tiling A square floor is to be tiled with square tiles as shown. There are blue tiles on the main diagonals and red tiles everywhere else. In all cases, both blue and red tiles must be used. and the two diagonals must have a common blue tile at the center of the floor. If 81 blue tiles will be used, how many red tiles will be needed?arrow_forwardFind the values of n, if the points (n + 1, 2n), (3n, 2n + 3) and (5n + 1,5n) are collinear. Find the value of k that the four points (4,1,2), (5, k, 6), (5,1,-1) and (7,4,0) are coplanar. Find the value of r if the area of the triangle is formed by the points (-3,6),(4,4) and (r,-2) is 12 sq units. Find the volume of tetrahedron whose vertices are A(1,1,0), B(-4,3,6), C(-1,0,3) and D(2,4,-5).arrow_forward- Consider the following system of linear equations in the variables a,b,c,d: 5a-3b 7c - 2d = 2 2ab 2c+ 5d = -3 → (*) 4a 3b 5d = 3 6a b+2c+ 7d = −7 (a) Solve the system (*) by using Gauss elimination method. (b) Solve the system (*) by using Cramer's rule method.arrow_forward
- Solve for a 25 55 30 a=?arrow_forward9:41 … 93 Applying an Exponential Function to Newton's Law of Cooling 60. Water in a water heater is originally Aa ← 122°F. The water heater is shut off and the water cools to the temperature of the surrounding air, which is 60°F. The water cools slowly because of the insulation inside the heater, and the value of k is measured as 0.00351. a. Write a function that models the temperature T (t) (in °F) of the water t hours after the water heater is shut off. b. What is the temperature of the water 12 hr after the heater is shut off? Round to the nearest degree. c. Dominic does not like to shower with water less than 115°F. If Dominic waits 24 hr. will the water still be warm enough for a shower? Mixed Exercises ger-ui.prod.mheducation.comarrow_forwardPlease use the infinite series formula and specify how you did each step. Thank you.arrow_forward
- 8) Solve the given system using the Gaussian Elimination process. 2x8y = 3 (-6x+24y = −6arrow_forward7) Solve the given system using the Gaussian Elimination process. (5x-4y = 34 (2x - 2y = 14arrow_forward33 (a) (b) Let A(t) = = et 0 0 0 cos(t) sin(t) 0-sin(t) cos(t)) For any fixed tЄR, find det(A(t)). Show that the matrix A(t) is invertible for any tЄ R, and find the inverse (A(t))¹.arrow_forward
 Algebra and Trigonometry (6th Edition)AlgebraISBN:9780134463216Author:Robert F. BlitzerPublisher:PEARSON
 Contemporary Abstract AlgebraAlgebraISBN:9781305657960Author:Joseph GallianPublisher:Cengage Learning
 Linear Algebra: A Modern IntroductionAlgebraISBN:9781285463247Author:David PoolePublisher:Cengage Learning
 Algebra And Trigonometry (11th Edition)AlgebraISBN:9780135163078Author:Michael SullivanPublisher:PEARSON
 Introduction to Linear Algebra, Fifth EditionAlgebraISBN:9780980232776Author:Gilbert StrangPublisher:Wellesley-Cambridge Press
 College Algebra (Collegiate Math)AlgebraISBN:9780077836344Author:Julie Miller, Donna GerkenPublisher:McGraw-Hill Education