
Concept explainers
a)
To determine: The control limits for the mean and range chart and the overall means
Introduction: Control charts used to determine whether the process is under control or not. Attributes and variables are the factors under the control charts.
a)
Answer to Problem 11P
Hence, the UCL for
Explanation of Solution
Given information:
The following information is given:
| Sample | Sample mean (in.) | Range (in.) |
| 1 | 10.002 | 0.011 |
| 2 | 10.002 | 0.014 |
| 3 | 9.991 | 0.007 |
| 4 | 10.006 | 0.022 |
| 5 | 9.997 | 0.013 |
| 6 | 9.999 | 0.012 |
| 7 | 10.001 | 0.008 |
| 8 | 10.005 | 0.013 |
| 9 | 9.995 | 0.004 |
| 10 | 10.001 | 0.011 |
| 11 | 10.001 | 0.014 |
| 12 | 10.006 | 0.009 |
Twelve samples that contain five parts each were taken.
Calculate the average for sample and range:
| Sample | Sample mean (in.) | Range (in.) |
| 1 | 10.002 | 0.011 |
| 2 | 10.002 | 0.014 |
| 3 | 9.991 | 0.007 |
| 4 | 10.006 | 0.022 |
| 5 | 9.997 | 0.013 |
| 6 | 9.999 | 0.012 |
| 7 | 10.001 | 0.008 |
| 8 | 10.005 | 0.013 |
| 9 | 9.995 | 0.004 |
| 10 | 10.001 | 0.011 |
| 11 | 10.001 | 0.014 |
| 12 | 10.006 | 0.009 |
| Total | 120.006 | 0.138 |
| Average | 10.0005 | 0.0115 |
Working note:
Average for sample:
It is calculated by dividing the total of sample and number of samples. Hence, the value of
Average for range:
It is calculated by dividing the total of range and number of samples. Hence, the value of
Determine the UCL and LCL for mean:
Formulae to calculate control limits:
Here, the overall mean
Substitute the values in equation (1) to determine the value of UCL as follows:
Hence, the UCL value is 10.00714.
Substitute the values in equation (2) to determine the value of LCL as follows:
Hence, the LCL value is 9.993865.
Therefore for the
Determine the UCL and LCL for range:
Formulae to calculate control limits:
Here,
The average range is
Substitute the values in equation (3) to determine the value of UCL as follows:
Hence, the UCL value is 0.024323.
Substitute the values in equation (4) to determine the value of LCL as follows:
Hence, the LCL value is 0.
Therefore, for the R-chart, the upper control limit is
b)
To plot: The values of sample means and ranges in the chart.
Introduction: Control charts used to determine whether the process is under control or not. Attributes and variables are the factors under the control charts.
b)
Answer to Problem 11P
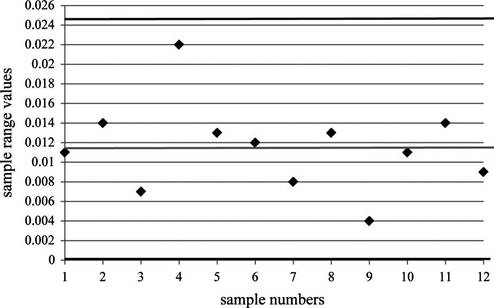
Control chart has been plotted for sample means and ranges.
Explanation of Solution
Given information:
The following information is given:
| Sample | Sample mean (in.) | Range (in.) |
| 1 | 10.002 | 0.011 |
| 2 | 10.002 | 0.014 |
| 3 | 9.991 | 0.007 |
| 4 | 10.006 | 0.022 |
| 5 | 9.997 | 0.013 |
| 6 | 9.999 | 0.012 |
| 7 | 10.001 | 0.008 |
| 8 | 10.005 | 0.013 |
| 9 | 9.995 | 0.004 |
| 10 | 10.001 | 0.011 |
| 11 | 10.001 | 0.014 |
| 12 | 10.006 | 0.009 |
Twelve samples that contain five parts each were taken.
Plot the sample mean values in the
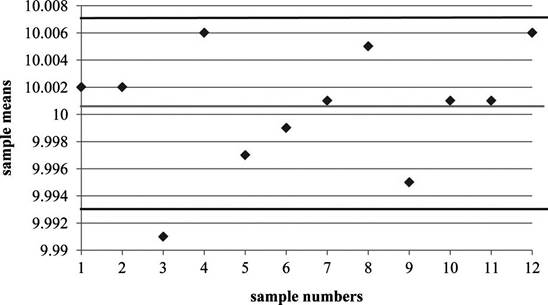
Note: Observe that sample 3 mean value is lower than the
Plot the sample mean values in theR-control chart where
c)
To determine: Whether the process is in control
Introduction: Control charts used to determine whether the process is under control or not. Attributes and variables are the factors under the control charts.
c)
Answer to Problem 11P
Process is out of control during sample #3 in
Explanation of Solution
Given information:
The following information is given:
| Sample | Sample mean (in.) | Range (in.) |
| 1 | 10.002 | 0.011 |
| 2 | 10.002 | 0.014 |
| 3 | 9.991 | 0.007 |
| 4 | 10.006 | 0.022 |
| 5 | 9.997 | 0.013 |
| 6 | 9.999 | 0.012 |
| 7 | 10.001 | 0.008 |
| 8 | 10.005 | 0.013 |
| 9 | 9.995 | 0.004 |
| 10 | 10.001 | 0.011 |
| 11 | 10.001 | 0.014 |
| 12 | 10.006 | 0.009 |
Twelve samples that contain five parts each were taken.
Determine whether the process is in control:
Since, the mean for sample #3 is outside the control limits of the
d)
To determine: Why the process is not in control
Introduction: Control charts used to determine whether the process is under control or not. Attributes and variables are the factors under the control charts.
d)
Explanation of Solution
Given information:
The following information is given:
| Sample | Sample mean (in.) | Range (in.) |
| 1 | 10.002 | 0.011 |
| 2 | 10.002 | 0.014 |
| 3 | 9.991 | 0.007 |
| 4 | 10.006 | 0.022 |
| 5 | 9.997 | 0.013 |
| 6 | 9.999 | 0.012 |
| 7 | 10.001 | 0.008 |
| 8 | 10.005 | 0.013 |
| 9 | 9.995 | 0.004 |
| 10 | 10.001 | 0.011 |
| 11 | 10.001 | 0.014 |
| 12 | 10.006 | 0.009 |
Twelve samples that contain five parts each were taken.
Determine why the process is not in control:
Further investigations are necessary to check whether the mean value of sample #3 is a freak incident outside the three sigma limits (which has a 0.27% probability). Perhaps 12 more samples can be drawn and examined whether such an incident occurs again. In case it happens again, the process needs to be examined in detail.
Want to see more full solutions like this?
Chapter 6 Solutions
PRIN.OF OPERATIONS MANAGEMENT-MYOMLAB


- With regard to reputation in negotiation, negotiators who use adversarial, stubborn, and ethically questionable behavior often have the effect of _____. A. improving their business relationships B. decreasing their effectiveness as a negotiator C. improving their business relationships D. decreasing their group statusarrow_forwardWhen it comes to assertiveness, there is only a modest link between negotiators' self-views and how the counterparty sees them. Many negotiators come away from a negotiation thinking they came on too strong with the counterparty. The _____ refers to the fact that negotiators believe they are coming on too strong with the counterparty, but they actually are not. A. Collective trap illusion B. Attribution error C. Aggressive anchoring bias D. Line-crossing illusionarrow_forwardAs you think about the issue of using chatbots in contract negotiations, consider whether other facets and concepts of negotiations that we have discussed and whether they would be adequately addressed.arrow_forward
- While I am not a fan of AI as of yet, I do understand the endless possibilities. Based on the research, it is clear that AI has great potential for negotiation (Yang, 2025). Herold et al. (2025) suggested that AI can flag potential risks and liabilities, allowing negotiators to address them and mitigate potential problems proactively. AI can draft new contract templates by examining industry standards and past contracts, and AI technology can help lawyers spot errors and inconsistencies in contract drafts. In relation to risk management, AI can flag possible risks and liabilities, allowing negotiators to proactively address them and lessen potential problems, which can speed up the negotiation process, making the negotiation efficient because AI can industrialize tasks like document review, redlining, and finding potential issues, significantly reducing negotiation time. Lastly, AI can analyze vast amounts of data and identify errors, inconsistencies, and irregularities in…arrow_forwardWhat is a main thought on using AI in contract negotiations?arrow_forwardWhat are some people thoughts on using AI in contract negotiations?arrow_forward
- 3. Develop a high-level or summary: a. Risk Management Plan Focus on specific, actionable steps for each risk and mitigation strategy.Provide detailed timelines for procurement, stakeholder engagement, and risk monitoring.Avoid over-simplifying and add more technical details in areas like quality assurance and financial control measures. Add a risk prioritization method and mention how risks will be monitored and reviewed throughout the project lifecycle. Overall, it is well organized andc overs key risks.arrow_forward3. Develop a high-level or summary: Human Resource Management Plan Provide more concrete timelines and actionable steps for human resource management.Include more detailed risk management strategies and link them more explicitly to the overall project plan.Expand on how training and development will be evaluated and tracked.Also, the overall length is good, but some sections could be condensed by eliminating repetition (e.g., you discuss stakeholder communication and engagement in two sections without adding new information).Try not to repeat the same risk management ideas (e.g., resource sharing and stakeholder concerns) in multiple sections without adding value.arrow_forwardBased on the U.S. Department of Transporation's publication on the number of inrternatioal passengers that come through New York airport (JFK) in 2012, how would I estimate the passenger volume for the coming year?arrow_forward
- What are the role of trends and seasonality based on the Department of Transportation publication of the number of international passengers that come through New York (JFK) in 2012?arrow_forward(All info i was given, i simplified it) Gas sales across type: 80% of gas sales tend to be regular. 15% midgrade, 5% tend to be premium. $0.10 increase in price per gallon tends to decrease gallons sold by 1 to 3%. Jan-0.87, Feb-0.95, Mar-1.00, Apr-1.05, May-1.08, Jun1.15, Jul-1.13, Aug-1.07, Sep-1.02, Oct-0.94, Nov-0.89, Dec-0.85. You want the MAPE to be below 20%, if ypu can get it to or below 10% they'll throw in extra $10k bonus. They wont get bonus if it is above 11% or 20%. It cannot be over 20%. Forecast for January 2025 andarrow_forwardWhat variables can I expect to influence the number of international travelers to New York (JFK) airport based on the U.S. Department of Transportation?arrow_forward
 Practical Management ScienceOperations ManagementISBN:9781337406659Author:WINSTON, Wayne L.Publisher:Cengage,
 Foundations of Business (MindTap Course List)MarketingISBN:9781337386920Author:William M. Pride, Robert J. Hughes, Jack R. KapoorPublisher:Cengage Learning
 Foundations of Business - Standalone book (MindTa...MarketingISBN:9781285193946Author:William M. Pride, Robert J. Hughes, Jack R. KapoorPublisher:Cengage Learning