
Concept explainers
a)
To determine: The value of
Introduction: Control charts used to determine whether the process is under control or not. Attributes and variables are the factors under the control charts.
a)
Answer to Problem 10P
The value of
Explanation of Solution
Given information:
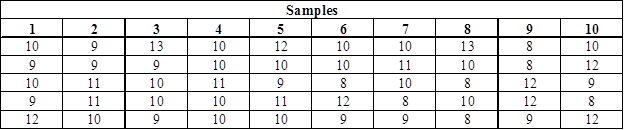
The following information is given:
Determine
The standard deviation of the sample means denoted by
Here,
σ refers to process standard deviation
n refers to the sample size.
The given values are
The standard deviation of the sample means
b)
To determine: The control limits for the mean chart if the value of z is 3.
Introduction: Control charts used to determine whether the process is under control or not. Attributes and variables are the factors under the control charts.
b)
Answer to Problem 10P
The UCL value of
Explanation of Solution
Given information:
The following information is given:
Sample size is given as 5 and process standard deviation is given as 1.36.
Determine the control limits for the mean chart if the value of z is 3:
Formulae to calculate control limits:
Here,
The value of
the standard deviation of the mean
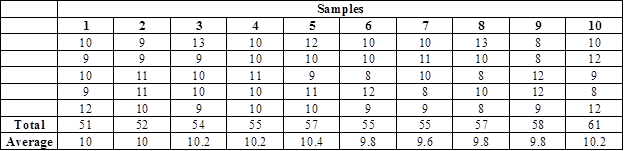
Calculate the average for each sample:
Working note:
Average for sample #1:
It is calculated by dividing the total of sample #1 and sample size.
Note: The same continues for all the samples.
Calculate the value of
It is calculated by dividing the sum of average of all the samples and the number of samples. Hence, the value of
Substitute the values in equation (1)to determine the value of UCL as follows:
Hence, the UCL value is 11.83.
Substitute the values in equation (2) to determine the value of LCL as follows:
Hence, the LCL value is 8.17.
c)
To determine: The control limits for the range chart.
Introduction: Control charts used to determine whether the process is under control or not. Attributes and variables are the factors under the control charts.
c)
Answer to Problem 10P
The UCL value of R-chart is 6.9795 and the LCL value is 0.
Explanation of Solution
Given information:
The following information is given:
Sample size is given as 5 and process standard deviation is given as 1.36.
Determine the control limits for the mean chart if the value of z is 3:
Formulae to calculate control limits:
Here,
Substitute the values in equation (3) to determine the value of UCL as follows:
Hence, the UCL value is 6.9795.
Substitute the values in equation (4) to determine the value of LCL as follows:
Hence, the LCL value is 0.
d)
To determine: Whether the process is in control.
Introduction: Control charts used to determine whether the process is under control or not. Attributes and variables are the factors under the control charts.
d)
Answer to Problem 10P
The process is in statistical control.
Explanation of Solution
Given information:
The following information is given:
Sample size is given as 5 and process standard deviation is given as 1.36.
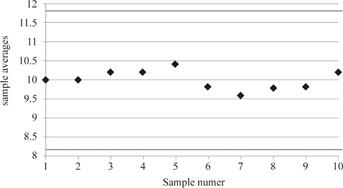
Plot the sample mean values in the
Plot the sample mean values in theR-control chart where
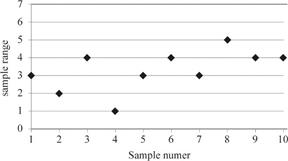
The sample range values lie well within the upper control limit and lower control limits.
The process is in statistical control.
Want to see more full solutions like this?
Chapter 6 Solutions
PRIN.OF OPERATIONS MANAGEMENT-MYOMLAB


- Following their early success and growth, Listo hired a number of new managers and employees. In response to the expansion of staff, Listo reorganized by adding layers of supervisors and managers between executive management and line staff; however, growth occurred so rapidly that proper training was not provided to the new employees. Management was less concerned with the employees’ opinions and was more focused on production and profit. Instead of enlisting employees’ opinions, more directive orders were given. The change and increased complexity associated with adding new layers to the hierarchy resulted in the organization’s goals and objectives becoming unclear. Employees began to complain about the new bureaucratic processes and the slow pace of decision-making. While the organization has been growing in size, productivity has slowed and quality has decreased. The turnover rate is higher than it has ever been, and the number of sick days that people take has doubled over the past…arrow_forwardFollowing their early success and growth, Listo hired a number of new managers and employees. In response to the expansion of staff, Listo reorganized by adding layers of supervisors and managers between executive management and line staff; however, growth occurred so rapidly that proper training was not provided to the new employees. Management was less concerned with the employees’ opinions and was more focused on production and profit. Instead of enlisting employees’ opinions, more directive orders were given. The change and increased complexity associated with adding new layers to the hierarchy resulted in the organization’s goals and objectives becoming unclear. Employees began to complain about the new bureaucratic processes and the slow pace of decision-making. While the organization has been growing in size, productivity has slowed and quality has decreased. The turnover rate is higher than it has ever been, and the number of sick days that people take has doubled over the past…arrow_forwardDiscuss in detail any five types of authority. give citations and referencearrow_forward
- Can you guys help me with this? Thank you! Business Environment: Provide insights into the guidelines for conducting business in the chosen country and working there as an expatriate. This information is vital for understanding the practicalities of engagement in that particular environment. The country in here is India Put the answer as bullet points, provide sources that have relevant information for the answer on economic factorsarrow_forwardCan you guys help me with this? Thank you! Intriguing Facts: Incorporate engaging facts about the country that enhance its value and uniqueness within the global supply chain landscape. These can include cultural anecdotes, technological innovations, or historical achievements. The country in here is India Put the answer as bullet points, provide sources that have relevant information for the answer on economic factorsarrow_forwardCan you guys help me with this? Thank you! Economic Factors: Evaluate the country's economic performance by analyzing key indicators such as GDP (Gross Domestic Product), GDP per capita, exports, and imports. These metrics provide insight into the country's economic prowess and its position in global trade. The country in here is India Put the answer as bullet points, provide sources that have relevant information for the answer on economic factorsarrow_forward
- provide scholarly reseach and define legal and complince risk and reputational risk in banking. Additionally 1. What more can be done about it 2. the department where the risk is exposed to 3. what strategy can be used 4. responsible personarrow_forwardRead the case in the link below and Develop a risk management programme appropriate for this case using the attached template. https://finopsinfo.com/investors/citis-900m-blunder-casts-light-on-poor-loan-ops/arrow_forwardDo the inherent differences between private and public sector objectives—profit versus publicgood—render private sector category management practices unsuitable for public sectorpurchasing, where open tendering is the norm?You have now undergone the Category Management classes and your superiors have requestedfor your input on how to integrate some of the learnings into the public sector policy. Discuss and elaborate what are the activities and governance you would introduce in yourrecommendations without violating the principle of transparency and accountability withinyour organisation. This is based on Singapore context. Pls provide a draft with explanation, examples and useful links for learning purposes. Citations will be good too. This is a module in SUSS called category management and supplier evaluationarrow_forward
- provide scholarly answers for what risk was associated with the Citibank bank loosing 50 million in August 2020arrow_forwardConclusion: The report recommendations and broad conclusion to the essay. TOTAL 5 100arrow_forwardAs part of your new role, as a strategy consultant and member of the steering committee, discuss what logistics and transportation strategies you will execute to achieve operational efficiencies and facilitate economic growth in SA. The committee would like to have a implementable strategic transport and logistics plan to realise the roadmap vision based on the subsection numbering given below! QUESTION ONE Introduction: Must include an overview and history of South Africa's Road, rail and freight transport network. Marks 5arrow_forward
 Practical Management ScienceOperations ManagementISBN:9781337406659Author:WINSTON, Wayne L.Publisher:Cengage,
 Foundations of Business (MindTap Course List)MarketingISBN:9781337386920Author:William M. Pride, Robert J. Hughes, Jack R. KapoorPublisher:Cengage Learning
 Foundations of Business - Standalone book (MindTa...MarketingISBN:9781285193946Author:William M. Pride, Robert J. Hughes, Jack R. KapoorPublisher:Cengage Learning