
(a)
Interpretation:
The engineering stress-strain curve and true stress-strain curve should be plotted with the use of data provided of cold-rolled and annealed brass.
Concept Introduction:
Engineering stress is a term explained as a force or applied load on the given object's initial cross-sectional area and it is also known as nominal stress.
Engineering strain is a term representing the amount of deformation of the material in the direction of force applied divided by the initial material length.
True stress is the required amount of force that tends to deformation of the specimen.
True strain or reduction of area are defined as the length change of the specimen due to the applied force on it.
Answer to Problem 6.37P
Below graph represents the engineering stress-strain curve and true stress-strain curve given sample of cold-rolled and annealed brass.

Explanation of Solution
The tabular data providing details about the load and length difference for given sample is as follows:
Table:
| Load(N) | |
| 0 | 0.00000 |
| 66 | 0.0112 |
| 177 | 0.0157 |
| 327 | 0.0199 |
| 462 | 0.0240 |
| 797 | 1.72 |
| 1350 | 5.55 |
| 1720 | 8.15 |
| 2220 | 13.07 |
| 2690 | 22.77 (maximum load) |
| 2410 | 25.25 (fracture) |
Let us calculate the engineering stress for the sample with the help of below formula:
For determining the engineering strain of the given sample,
Now, find true strain as well as true stress with the help for below formulas:
- True strain:
- True stress:
Tabulate the data with the use of engineering stress, engineering strain, true strain and true stress as below:
| Load(N) | Displacement ( | Engineering stress (S) MPa | Engineering strain (e) | True strain ( | True stress( |
| 0 | 0.00000 | 0 | 2 | 0 | 0 |
| 66 | 0.0112 | 6.29 | 0.00032 | 0.00032 | 6.29 |
| 177 | 0.0157 | 16.86 | 0.00044 | 0.00044 | 16.87 |
| 327 | 0.0199 | 31.13 | 0.00056 | 0.00056 | 31.16 |
| 462 | 0.0240 | 44 | 0.00068 | 0.00068 | 43 |
| 797 | 1.72 | 75.90 | 0.04914 | 0.04797 | 79.54 |
| 1350 | 5.55 | 129 | 0.15857 | 0.14718 | 148 |
| 1720 | 8.15 | 164 | 0.23285 | 0.20932 | 198 |
| 2220 | 13.07 | 211 | 0.37342 | 0.31732 | 279 |
| 2690 | 22.77 | 256 | 0.65056 | 0.50111 | 423 |
| 2410 | 25.25 | 230 | 0.72142 | 0.54315 | 355 |
Now, plot the true stress-strain curve and engineering stress-strain curve from the above gathered tabular data as below:

(b)
Interpretation:
With the help of plotted engineering stress-strain curve and true stress-strain curve, the explanation should be given for relative values of true stress-strain and engineering stress-strain.
Concept Introduction:
Engineering stress is a term explained as a force or applied load on the given object's initial cross-sectional area and it is also known as nominal stress.
Engineering strain is a term representing the amount of deformation of the material in the direction of force applied divided by the initial material length.
True stress is the required amount of force that tends to deformation of the specimen.
True strain or reduction of area and defined as the length change of the specimen due to the applied force on it.
Answer to Problem 6.37P
At point of elastic loading and necking, less value of engineering stress and true strain is obtained while high value of true stress and engineering strain is obtained.
Explanation of Solution
Below graph represents the engineering stress-strain curve and true stress-strain curve given sample of cold-rolled and annealed brass.
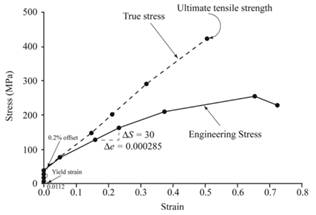
When there is a phase of elastic formation, the values of engineering stress-strain and true stress-strain are found closer to each other but after reviewing closely, one can justify that the values of true stress are higher than engineering stress values while true strain values are lower than engineering strain values. At the point of yielding phase, the differences of values become higher.
When tension test is performed, the cross-section area of sample getting reduced and there is an elongation of length determined by using instantaneous length changes. This result into high value of engineering strain as compared to true strain and low values of engineering stress compared to true stress prior to necking.
(c)
Interpretation:
The explanation should be given for the curve if prior known data was provided for true stress and strain at the point of necking.
Concept Introduction:
Modulus of elasticity is also known as coefficient of elasticity or elastic modulus and can be defined as the ratio of the stress in the given object body to the corresponding strain.
Answer to Problem 6.37P
If prior known data was provided for true stress and strain at the point of necking, one gets the continuously rising curve of true stress without indicating any highest point in this curve.
Explanation of Solution
The tabular data with the use of engineering stress, engineering strain, true strain and true stress is as below:
| Load(N) | Displacement ( | Engineering stress (S) MPa | Engineering strain (e) | True strain ( | True stress( |
| 0 | 0.00000 | 0 | 2 | 0 | 0 |
| 66 | 0.0112 | 6.29 | 0.00032 | 0.00032 | 6.29 |
| 177 | 0.0157 | 16.86 | 0.00044 | 0.00044 | 16.87 |
| 327 | 0.0199 | 31.13 | 0.00056 | 0.00056 | 31.16 |
| 462 | 0.0240 | 44 | 0.00068 | 0.00068 | 43 |
| 797 | 1.72 | 75.90 | 0.04914 | 0.04797 | 79.54 |
| 1350 | 5.55 | 129 | 0.15857 | 0.14718 | 148 |
| 1720 | 8.15 | 164 | 0.23285 | 0.20932 | 198 |
| 2220 | 13.07 | 211 | 0.37342 | 0.31732 | 279 |
| 2690 | 22.77 | 256 | 0.65056 | 0.50111 | 423 |
| 2410 | 25.25 | 230 | 0.72142 | 0.54315 | 355 |
The known value of true stress and strain may have not given us the curve of true stress-strain with the highest point and rather it would have shown continuous rise in the true stress.
(d)
Interpretation:
With the help of plotted engineering and true stress-strain curve, the 0.2 % offset yield strength should be calculated for the given data of cold-rolled and annealed brass.
Concept Introduction:
The maximum amount of elastic deformation which is bearable by any material is defined as yield strength.
Answer to Problem 6.37P
The yield strength for 0.2% offset is 45 MPa for a given sample of cold-rolled and annealed brass.
Explanation of Solution
The tabular data with the use of engineering stress, engineering strain, true strain and true stress is as below:
| Load(N) | Displacement ( | Engineering stress (S) MPa | Engineering strain (e) | True strain ( | True stress( |
| 0 | 0.00000 | 0 | 2 | 0 | 0 |
| 66 | 0.0112 | 6.29 | 0.00032 | 0.00032 | 6.29 |
| 177 | 0.0157 | 16.86 | 0.00044 | 0.00044 | 16.87 |
| 327 | 0.0199 | 31.13 | 0.00056 | 0.00056 | 31.16 |
| 462 | 0.0240 | 44 | 0.00068 | 0.00068 | 43 |
| 797 | 1.72 | 75.90 | 0.04914 | 0.04797 | 79.54 |
| 1350 | 5.55 | 129 | 0.15857 | 0.14718 | 148 |
| 1720 | 8.15 | 164 | 0.23285 | 0.20932 | 198 |
| 2220 | 13.07 | 211 | 0.37342 | 0.31732 | 279 |
| 2690 | 22.77 | 256 | 0.65056 | 0.50111 | 423 |
| 2410 | 25.25 | 230 | 0.72142 | 0.54315 | 355 |
Below graph represents the engineering stress-strain curve and true stress-strain curve given sample of cold-rolled and annealed brass.

The above graph can provide the value of yield strength for 0.2% offset as 45 MPa.
Therefore, one can conclude that the given sample contains the yield strength for 0.2% offset as 45MPa.
(e)
Interpretation:
With the help of plotted engineering and true stress-strain curve, the tensile strength should be calculated for the given data of cold-rolled and annealed brass.
Concept Introduction:
The tensile strength can be defined as the measurement of maximum deformation which can be bearable by any material without undergoing necking condition.
Answer to Problem 6.37P
The tensile strength is 256.1MPa for a given sample of cold-rolled and annealed brass.
Explanation of Solution
The tabular data with the use of engineering stress, engineering strain, true strain and true stress is as below:
| Load(N) | Displacement ( | Engineering stress (S) MPa | Engineering strain (e) | True strain ( | True stress( |
| 0 | 0.00000 | 0 | 2 | 0 | 0 |
| 66 | 0.0112 | 6.29 | 0.00032 | 0.00032 | 6.29 |
| 177 | 0.0157 | 16.86 | 0.00044 | 0.00044 | 16.87 |
| 327 | 0.0199 | 31.13 | 0.00056 | 0.00056 | 31.16 |
| 462 | 0.0240 | 44 | 0.00068 | 0.00068 | 43 |
| 797 | 1.72 | 75.90 | 0.04914 | 0.04797 | 79.54 |
| 1350 | 5.55 | 129 | 0.15857 | 0.14718 | 148 |
| 1720 | 8.15 | 164 | 0.23285 | 0.20932 | 198 |
| 2220 | 13.07 | 211 | 0.37342 | 0.31732 | 279 |
| 2690 | 22.77 | 256 | 0.65056 | 0.50111 | 423 |
| 2410 | 25.25 | 230 | 0.72142 | 0.54315 | 355 |
Below graph represents the engineering stress-strain curve and true stress-strain curve given sample of cold-rolled and annealed brass.

The tensile strength can be determined by use of below mentioned formula:
Therefore, one can conclude that the given sample of cold-rolled and annealed brass has the tensile strength of 256.1MPa.
(f)
Interpretation:
With the help of plotted engineering and true stress-strain curve, the value of modulus of elasticity should be calculated for the given data of cold-rolled and annealed brass.
Concept Introduction:
Modulus of elasticity is also known as coefficient of elasticity or elastic modulus and can be defined as the ratio of the stress in the given object body to the corresponding strain.
Answer to Problem 6.37P
The value of modulus of elasticity is 105.2GPafor a given sample of cold-rolled and annealed brass.
Explanation of Solution
The tabular data with the use of engineering stress, engineering strain, true strain and true stress is as below:
| Load(N) | Displacement ( | Engineering stress (S) MPa | Engineering strain (e) | True strain ( | True stress( |
| 0 | 0.00000 | 0 | 2 | 0 | 0 |
| 66 | 0.0112 | 6.29 | 0.00032 | 0.00032 | 6.29 |
| 177 | 0.0157 | 16.86 | 0.00044 | 0.00044 | 16.87 |
| 327 | 0.0199 | 31.13 | 0.00056 | 0.00056 | 31.16 |
| 462 | 0.0240 | 44 | 0.00068 | 0.00068 | 43 |
| 797 | 1.72 | 75.90 | 0.04914 | 0.04797 | 79.54 |
| 1350 | 5.55 | 129 | 0.15857 | 0.14718 | 148 |
| 1720 | 8.15 | 164 | 0.23285 | 0.20932 | 198 |
| 2220 | 13.07 | 211 | 0.37342 | 0.31732 | 279 |
| 2690 | 22.77 | 256 | 0.65056 | 0.50111 | 423 |
| 2410 | 25.25 | 230 | 0.72142 | 0.54315 | 355 |
Below graph represents the engineering stress-strain curve and true stress-strain curve given sample of cold-rolled and annealed brass.

The modulus of elasticity can be determined by use of below mentioned formula:
In above equation,
Therefore, the value of modulus of elasticity for given cold-rolled and annealed brassas 105.2 GPa.
Want to see more full solutions like this?
Chapter 6 Solutions
Essentials Of Materials Science And Engineering

- Q1) Choose the correct answer: 1- Rankine's theory of earth pressure neglect: The pressure on the wall is to act parallel to the surface of the soil at angle (B) to the horizontal. The effect of cohesion on active and passive pressure. The friction developed between a retaining wall and the soil. o The depth of tension zone. o The effect of water table. 2- The lateral earth pressure is the lateral pressure that developed from: o Water beside it. o Soil beside structure. o External loads. o All the above. o Excavation beside structure. 3- The coefficient of earth pressure at rest represented as o Ko-1-sing expression given by Jaky. o Ko-sing 。 Ko-1-cosp о o Ko-cosp 。 Ko" tano 4- If the backfill carries a uniform surcharge q, then the lateral pressure at the depth of wall His: o pa-Ka yz+Ka q o pa Ka yz-Ka q o pa Ka yz*Ka q o pa Ka yz/Ka q 。 pa=Ka yz+q 5- During the active state of plastic equilibrium, the retaining wall moves: o Towards the fill o Away from the fill o Does not change…arrow_forwardس 1: سم ، خمن كمية الأعمال الترابية اللازمة لتنفيذ جزء من القناة وفقًا للبيانات التالية: عرض القناة = 3م المنحدر الجانبي في الحفر = 1:1 وفي الدفن = 1:1.5 عرض الضفة = 2 م من الجانبين عمق الاملاء الكامل ) full supply depth)= 80 السافة العمودية بين اعلى مستوى للمياه واعلى نقطة في الضفة الجانبية ( free board) = 40 سم، ميل القاعدة = 1:5000 مستوى قاعدة القناة المقترح R.D. (m) 1000 2000 3000 4000 G.L. (m) 210.8 210.4 208.8 208.4 FSD 210= (P.B.L) BANK OF CHANNELarrow_forwardA 8.5 meter simply supported reinforced concrete beam on parallel rectangular column, where the column width is 300 mm is shown in Figure carries a uniformly distributed variable action of 10 kN/m and permanent action of 9 kN/m (including self-weight of beam). The clear cover of beam for class XC-1 is 25 mm, diameter of main and shear reinforcement are 20 mm and 8 mm respectively. The characteristic material strengths are fck = 30 N/mm² and fyk = 500 N/mm². Apply variable Strut Inclination Method to design the shear reinforcement (links) for the beam. h = 370 mm 마 *b = 230 mm Section A-Aarrow_forward
- Q2- For the retaining wall shown in the figure, calculate the magnitude and resultant, of active thrust and calculate only the magnitude of passive thrust. q = 10kN/m² 不 2 m y-18 kN/m³ 0=35° C=0 * 2 m y=18 kN/m³ 0=20° 6 m C=15 kN/m² y=18 kN/m³ 0-20° C=15 kN/m² 2arrow_forwardThe MATLAB code is going well but the last part in bandpass, the legend that is supposed to tell the color of both lower and upper-frequency cutoff does not align with each other. As such I need help My Matlab code: % Define frequency range for the plot f = logspace(1, 5, 500); % Frequency range from 10 Hz to 100 kHz w = 2 * pi * f; % Angular frequency % Parameters for the filters R = 1e3; % Resistance in ohms (1 kΩ) C = 1e-6; % Capacitance in farads (1 μF) L = 0.1; % Inductance in henries (chosen for proper bandpass response) % Compute cutoff frequencies f_cutoff_RC = 1 / (2 * pi * R * C); % RC low-pass/high-pass cutoff f_resonance = 1 / (2 * pi * sqrt(L * C)); % Resonant frequency of RLC Q_factor = (1/R) * sqrt(L/C); % Quality factor of the circuit % Band-pass filter cutoff frequencies f_lower_cutoff = f_resonance / (sqrt(1 + 1/(4*Q_factor^2)) + 1/(2*Q_factor)); f_upper_cutoff = f_resonance / (sqrt(1 + 1/(4*Q_factor^2)) - 1/(2*Q_factor)); % Define Transfer Functions H_low =…arrow_forward(◉ Home - my.uah.edu Homework#5 MasteringEngineering Mastering X + 8 https://session.engineering-mastering.pearson.com/myct/itemView?assignmentProblemID=18992148&offset=nextarrow_forwardأ. ما هي شروط حديد التسليح المستخدم في موقع العمل بشكل عام وكيف يجب ان يكون ؟ ب. كم حلقة تحتاج لاساس شريطي طوله 40 مترا اذا كان مكتوب في المخطط ( mm 300 @ 010) ؟ B - لمقطع الأساس الشريطي ادناه، احسب كمية الحديد الطولي السفلي والمواد الانشائية المطلوبة ) سمنت ، رمل ، حصى ( لكل 30 متر طول منه ونسب الخلط 1:3:5 اذا كان حديد التسليح المتوفر طول 9 متر . (15) درجة ) 3014 $10@200mm 4016 800mm A 400mm جدول اوزان حديد اتسليح قطر الشيش (mm) كتلة الشيش (kg/m) 0.222 6 0.395 8 0.617 10 0.888 12 1.21 14 1.58 16 2 18 2.47 20 3.86 25arrow_forwardCHAPTER 14: Kinetics of a Particle: Conservation of Energy Qu.4 The spring has a stiffness k = 200 N/m and an unstretched length of 0.5 m. If it is attached to the 3- kg smooth collar and the collar is released from rest at A, determine the speed of the collar when it reaches B. Neglect the size of the collar.please show all work step by steparrow_forwardQu. 2 The 100-kg crate is subjected to the action of two forces. If it is originally at rest, determine the distance it slides in order to attain a speed of 6 m/s. The coefficient of kinetic friction between the crate and the surface is uk = 0.2. i need to show all work step by step problemsarrow_forwardA4.2- Develop the column interaction diagram for a tied short column, shown in Figure 2. Given: f'c = 35 MPa fy = 400 MPa Longitudinal bars: 8-35M Ties: 10M@ 300 Clear cover to the ties: 40mm T 500 mm 500 mm Figure 2arrow_forward1° ⑤ Aa "Human-written solution required" 2. Using the characteristics of Fig. 6.11, determine ID for the following levels of VGs (with VDS > VP): a. VGs = 0V. b. VGs=-1 V. c. VGs -1.5 V. d. VGS -1.8 V. e. VGS = -4 V. f. VGs=-6V. 3. Using the results of problem 2 plot the transfer characteristics of ID vs. VGS- 4. a. Determine Vps for VGs = 0V and Ip = 6 mA using the characteristics of Fig. 6.11. b. Using the results of part (a), calculate the resistance of the JFET for the region Ip = 0 to 6 mA for VGs =0V. c. Determine Vps for VGS = -1 V and ID = 3 mA. d. Using the results of part (c), calculate the resistance of the JFET for the region ID = 0 to 3 mA for VGs -1 V. e. Determine Vps for VGs = -2 V and ID = 1.5 mA. f. Using the results of part (e), calculate the resistance of the JFET for the region ID = 0 to 1.5 mA for VGS-2 V. g. Defining the result of part (b) as ro, determine the resistance for VGs -1 V using Eq. (6.1) and compare with the results of part (d). h. Repeat part (g)…arrow_forward(◉ Home - my.uah.edu Homework#5 MasteringEngineering Mastering X + 8 https://session.engineering-mastering.pearson.com/myct/itemView?offset=next&assignmentProblemID=18992146arrow_forwardarrow_back_iosSEE MORE QUESTIONSarrow_forward_iosRecommended textbooks for you
 MATLAB: An Introduction with ApplicationsEngineeringISBN:9781119256830Author:Amos GilatPublisher:John Wiley & Sons Inc
 Essentials Of Materials Science And EngineeringEngineeringISBN:9781337385497Author:WRIGHT, Wendelin J.Publisher:Cengage,
 Industrial Motor ControlEngineeringISBN:9781133691808Author:Stephen HermanPublisher:Cengage Learning
 Basics Of Engineering EconomyEngineeringISBN:9780073376356Author:Leland Blank, Anthony TarquinPublisher:MCGRAW-HILL HIGHER EDUCATION
 Structural Steel Design (6th Edition)EngineeringISBN:9780134589657Author:Jack C. McCormac, Stephen F. CsernakPublisher:PEARSON
 Fundamentals of Materials Science and Engineering...EngineeringISBN:9781119175483Author:William D. Callister Jr., David G. RethwischPublisher:WILEY
MATLAB: An Introduction with ApplicationsEngineeringISBN:9781119256830Author:Amos GilatPublisher:John Wiley & Sons IncEssentials Of Materials Science And EngineeringEngineeringISBN:9781337385497Author:WRIGHT, Wendelin J.Publisher:Cengage,Industrial Motor ControlEngineeringISBN:9781133691808Author:Stephen HermanPublisher:Cengage LearningBasics Of Engineering EconomyEngineeringISBN:9780073376356Author:Leland Blank, Anthony TarquinPublisher:MCGRAW-HILL HIGHER EDUCATIONStructural Steel Design (6th Edition)EngineeringISBN:9780134589657Author:Jack C. McCormac, Stephen F. CsernakPublisher:PEARSONFundamentals of Materials Science and Engineering...EngineeringISBN:9781119175483Author:William D. Callister Jr., David G. RethwischPublisher:WILEY