
(a)
Interpretation:
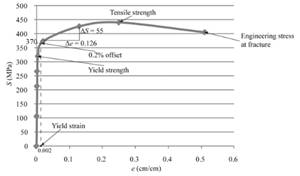
The engineering stress-strain curve should be plotted and the 0.2 % offset yield strength should be calculated for the given sample of a copper alloy.
Concept Introduction:
The maximum amount of elastic deformation which is bearable by any material is defined as its yield strength.
Answer to Problem 6.38P
The yield strength for 0.2% offset is 370 MPa for given sample of copper alloy.
Explanation of Solution
The tabular data for details about the load and length difference for given sample of copper alloy is as follows:
| Load(lb) | |
| 0 | 0.00000 |
| 3,000 | 0.00167 |
| 6,000 | 0.00333 |
| 7,500 | 0.00417 |
| 9,000 | 0.0090 |
| 10,500 | 0.040 |
| 12,000 | 0.26 |
| 12,400 | 0.50 (maximum load) |
| 11,400 | 1.02 (fracture) |
Calculate the stress for the sample with the help of following formula:
In equation (1), putting the value of d =1.263 cm,
In the equation (2) substituting value of F =13,340 N,
The below mentioned tabular data represents the value of engineering stress at different load applied at the given specimen of copper alloy:
| F(N) | S (MPa) |
| 0 | 0 |
| 13,340 | 106.5 |
| 26,690 | 213 |
| 33,360 | 266 |
| 40,030 | 320 |
| 46,700 | 373 |
| 53,380 | 426 |
| 55,160 | 440 |
| 50,710 | 405 |
Calculate the engineering strain for the sample of with the help of following formula:
The below mentioned tabular data represent the value of engineering stress at different load applied at the given specimen of copper alloy:
| e (cm/cm) | |
| 0.00000 | 0 |
| 0.00418 | 0.000836 |
| 0.00833 | 0.001666 |
| 0.1043 | 0.002086 |
| 0.0225 | 0.0045 |
| 0.1 | 0.02 |
| 0.65 | 0.13 |
| 1.25 | 0.25 |
| 2.55 | 0.51 |
Using both given spread sheets one can tabulate the engineering stress and strain curve as follows:

The above graph can provide the value of yield strength for 0.2% offset as 370 MPa.
Therefore, the copper alloy sample has the yield strength for 0.2% offset as 370 MPa.
(b)
Interpretation:
With the help of plotted engineering stress-strain curve, the tensile strength should be calculated for the given sample of a copper alloy.
Concept Introduction:
Tensile strength can be defined as the measurement of maximum deformation which can be bearable by any material without undergoing necking condition.
Answer to Problem 6.38P
The tensile strength is 440 MPa for given sample of copper alloy.
Explanation of Solution
With the use of given spread sheet and applied loads, one can tabulate the engineering stress and strain curve as below:
| F(N) | S (MPa) | e (cm/cm) | |
| 0 | 0 | 0.00000 | 0 |
| 13,340 | 106.5 | 0.00418 | 0.000836 |
| 26,690 | 213 | 0.00833 | 0.001666 |
| 33,360 | 266 | 0.1043 | 0.002086 |
| 40,030 | 320 | 0.0225 | 0.0045 |
| 46,700 | 373 | 0.1 | 0.02 |
| 53,380 | 426 | 0.65 | 0.13 |
| 55,160 | 440 | 1.25 | 0.25 |
| 50,710 | 405 | 2.55 | 0.51 |
With the use of given both spread sheets, one can tabulate the engineering stress and strain curve as follows:

The above graph can provide the value of tensile strength as 440 MPa.
Therefore, one can conclude that the given sample of copper alloy has a tensile strength as 440 MPa.
(c)
Interpretation:
With the help of plotted engineering stress-strain curve, the value of modulus of elasticity should be calculated for the given sample of a copper alloy.
Concept Introduction:
Modulus of elasticity is also known as coefficient of elasticity or elastic modulus and can be defined as the ratio of the stress in the given object body to the corresponding strain.
Answer to Problem 6.38P
The value of modulus of elasticity is 436.5 MPa for the given sample of a copper alloy.
Explanation of Solution
With the use of given spread sheet and applied loads, one can tabulate the engineering stress and strain curve as below:
| F(N) | S (MPa) | e (cm/cm) | |
| 0 | 0 | 0.00000 | 0 |
| 13,340 | 106.5 | 0.00418 | 0.000836 |
| 26,690 | 213 | 0.00833 | 0.001666 |
| 33,360 | 266 | 0.1043 | 0.002086 |
| 40,030 | 320 | 0.0225 | 0.0045 |
| 46,700 | 373 | 0.1 | 0.02 |
| 53,380 | 426 | 0.65 | 0.13 |
| 55,160 | 440 | 1.25 | 0.25 |
| 50,710 | 405 | 2.55 | 0.51 |
With the use of given both spread sheets, one can tabulate the engineering stress and strain curve as follows:

Using the formula of Hook's law, the modulus of elasticity can be calculated as follows:
Therefore, the value of modulus of elasticity can be described as 436.5 MPa for the given sample of a copper alloy.
(d)
Interpretation:
With the help of plotted engineering stress-strain curve, the value of % elongation should be calculated for the given sample of a copper alloy.
Concept Introduction:
Elongation is defined as term used to determine the change in gauge length of any material when it is on static tension test.
Answer to Problem 6.38P
The value of % elongation is 50.7% for the given sample of a copper alloy.
Explanation of Solution
With the use of given spread sheet and applied loads, one can tabulate the engineering stress and strain curve as below:
| F(N) | S (MPa) | e (cm/cm) | |
| 0 | 0 | 0.00000 | 0 |
| 13,340 | 106.5 | 0.00418 | 0.000836 |
| 26,690 | 213 | 0.00833 | 0.001666 |
| 33,360 | 266 | 0.1043 | 0.002086 |
| 40,030 | 320 | 0.0225 | 0.0045 |
| 46,700 | 373 | 0.1 | 0.02 |
| 53,380 | 426 | 0.65 | 0.13 |
| 55,160 | 440 | 1.25 | 0.25 |
| 50,710 | 405 | 2.55 | 0.51 |
Using both the spread sheets, the engineering stress and strain curve can be calculated as follows:

One can use the below formula for determining the value of % elongation.
Therefore, the value of % elongation is 50.7% for the given sample of a copper alloy.
(e)
Interpretation:
With the help of plotted engineering stress-strain curve, the value of % reduction in area should be calculated for the given sample of a copper alloy.
Concept Introduction:
Reduction of area of any material is directly related to the reduction in cross-section area of the tensile test piece after fracture.
Answer to Problem 6.38P
The value of % reduction in area is 45.20 % for the given sample of a copper alloy.
Explanation of Solution
With the use of given spread sheet and applied loads, one can tabulate the engineering stress and strain curve as below:
| F(N) | S (MPa) | e (cm/cm) | |
| 0 | 0 | 0.00000 | 0 |
| 13,340 | 106.5 | 0.00418 | 0.000836 |
| 26,690 | 213 | 0.00833 | 0.001666 |
| 33,360 | 266 | 0.1043 | 0.002086 |
| 40,030 | 320 | 0.0225 | 0.0045 |
| 46,700 | 373 | 0.1 | 0.02 |
| 53,380 | 426 | 0.65 | 0.13 |
| 55,160 | 440 | 1.25 | 0.25 |
| 50,710 | 405 | 2.55 | 0.51 |
With the use of given both spread sheets, one can tabulate the engineering stress and strain curve as follows:

One can use the below formula for determining the value of % reduction in area.
Therefore, the given sample of a copper alloy has the value of % reduction in area equals to 45.20 %.
(f)
Interpretation:
With the help of plotted engineering stress-strain curve, the engineering stress should be determined at fracture for the given sample of a copper alloy.
Concept Introduction:
Engineering stress is a term explained as a force or applied load on the given object's cross-sectional area and it is also known as nominal stress.
Answer to Problem 6.38P
The engineering stress is 410 MPa for the given sample of a copper alloy.
Explanation of Solution
With the use of given spread sheet and applied loads, we can tabulate the engineering stress and strain curve as below:
| F(N) | S (MPa) | e (cm/cm) | |
| 0 | 0 | 0.00000 | 0 |
| 13,340 | 106.5 | 0.00418 | 0.000836 |
| 26,690 | 213 | 0.00833 | 0.001666 |
| 33,360 | 266 | 0.1043 | 0.002086 |
| 40,030 | 320 | 0.0225 | 0.0045 |
| 46,700 | 373 | 0.1 | 0.02 |
| 53,380 | 426 | 0.65 | 0.13 |
| 55,160 | 440 | 1.25 | 0.25 |
| 50,710 | 405 | 2.55 | 0.51 |
With the use of given both spread sheets, one can tabulate the engineering stress and strain curve as follows:

From the above stress-strain curve, one can determine the engineering stress at fracture equals to 410 MPa.
Therefore, the engineering stress for the given sample of a copper alloy is 410 MPa.
(g)
Interpretation:
With the help of plotted engineering stress-strain curve, the true stress at necking should be determined at fracture for the given sample of a copper alloy.
Concept Introduction:
True stress can be defined as the applied force or load that is divided by the cross-sectional area of specimen or object. It can be also defined as the required amount of force that tends to deformation of specimen.
Answer to Problem 6.38P
The true stress is 550.33MPa for the given sample of a copper alloy.
Explanation of Solution
With the use of given spread sheet and applied loads, one can tabulate the engineering stress and strain curve as below:
| F(N) | S (MPa) | e (cm/cm) | |
| 0 | 0 | 0.00000 | 0 |
| 13,340 | 106.5 | 0.00418 | 0.000836 |
| 26,690 | 213 | 0.00833 | 0.001666 |
| 33,360 | 266 | 0.1043 | 0.002086 |
| 40,030 | 320 | 0.0225 | 0.0045 |
| 46,700 | 373 | 0.1 | 0.02 |
| 53,380 | 426 | 0.65 | 0.13 |
| 55,160 | 440 | 1.25 | 0.25 |
| 50,710 | 405 | 2.55 | 0.51 |
With the use of given both spread sheets, one can tabulate the engineering stress and strain curve as follows:

For calculating the true stress at necking, the formula used is as follows:
Therefore, the true stress for the given sample of a copper alloy is 550.33MPa at point of necking.
(h)
Interpretation:
With the help of plotted engineering stress-strain curve, the value of modulus of resilience should be determined for the given sample of a copper alloy.
Concept Introduction:
The amount of energy required to get absorbed by the material to return back to its original state is defined as resilience.
Modulus of resilience can be defined as the energy required by the material to return from its stress condition from zero to the yield stress limit.
Answer to Problem 6.38P
The value of modulus of resilience is 0.65MPa for the given sample of a copper alloy.
Explanation of Solution
With the use of given spread sheet and applied loads, one can tabulate the engineering stress and strain curve as below:
| F(N) | S (MPa) | e (cm/cm) | |
| 0 | 0 | 0.00000 | 0 |
| 13,340 | 106.5 | 0.00418 | 0.000836 |
| 26,690 | 213 | 0.00833 | 0.001666 |
| 33,360 | 266 | 0.1043 | 0.002086 |
| 40,030 | 320 | 0.0225 | 0.0045 |
| 46,700 | 373 | 0.1 | 0.02 |
| 53,380 | 426 | 0.65 | 0.13 |
| 55,160 | 440 | 1.25 | 0.25 |
| 50,710 | 405 | 2.55 | 0.51 |
With the use of given both spread sheets, one can tabulate the engineering stress and strain curve as follows:
Therefore, the value of modulus of resilience for the given sample of a copper alloy can be concluded as 0.65MPa
Want to see more full solutions like this?
Chapter 6 Solutions
Essentials Of Materials Science And Engineering

- For the circuit shown, find currents 11, 12, 13, and the voltage Vo. Assume ideal op-amp, and let R₁=3, R2-40, Ro=85 and 1-6 The current I₁ is: The current 12 is: The current 13 is: The voltage Vo is: R₂ w R₁ 13 w Roarrow_forwardFor the circuit shown, let v₂ = 9, R₁=86, R2= 15, R3 =7, assume ideal-op-amp, and find • The current l₂ = • Voltage gain, Av= Vo/Vs= • The output voltage vo = A US 1+ 1. R₁ R₂ R3 10 +arrow_forwardShow step by step solutionarrow_forward
- For the op-amp circuit shown, find the voltage Vo, and the current lo. Let R₁=8, R2=58, R3-27 and V₂-101. R1 + R₂ ww + V + The voltage Vo The current lo = = The relative tolerance for this problem is 3 % R3arrow_forward(read image) Answer: vC = 0.965 ft/sec rightarrow_forwardDraw the shear and the moment diagrams for each of the frames below. If the frame is statically indeterminate the reactions have been provided. Problem 1 (Assume pin connections at A, B and C). 30 kN 2 m 5 m 30 kN/m B 60 kN 2 m 2 m A 22 CO Carrow_forward
- (read image) Answer:arrow_forwardThis is an old exam practice question. The answer key says the answer is Pmax = 52.8kN but I am confused how they got that.arrow_forwardF12-45. Car A is traveling with a constant speed of 80 km/h due north, while car B is traveling with a constant speed of 100 km/h due east. Determine the velocity of car B relative to car A. pload Choose a File Question 5 VA - WB VBA V100 111413 + *12-164. The car travels along the circular curve of radius r = 100 ft with a constant speed of v = 30 ft/s. Determine the angular rate of rotation è of the radial liner and the magnitude of the car's acceleration. Probs. 12-163/164 pload Choose a File r = 400 ft 20 ptsarrow_forward
 MATLAB: An Introduction with ApplicationsEngineeringISBN:9781119256830Author:Amos GilatPublisher:John Wiley & Sons Inc
 Essentials Of Materials Science And EngineeringEngineeringISBN:9781337385497Author:WRIGHT, Wendelin J.Publisher:Cengage,
 Industrial Motor ControlEngineeringISBN:9781133691808Author:Stephen HermanPublisher:Cengage Learning
 Basics Of Engineering EconomyEngineeringISBN:9780073376356Author:Leland Blank, Anthony TarquinPublisher:MCGRAW-HILL HIGHER EDUCATION
 Structural Steel Design (6th Edition)EngineeringISBN:9780134589657Author:Jack C. McCormac, Stephen F. CsernakPublisher:PEARSON
 Fundamentals of Materials Science and Engineering...EngineeringISBN:9781119175483Author:William D. Callister Jr., David G. RethwischPublisher:WILEY