Concept explainers
Videos
Energy Efficiency of Biofuel Production Most of the plant material currently used for biofuel production in the United States consists of food crops—mainly corn, soybeans, and sugarcane. In 2006, David Tilman and his colleagues published the results of a 10-year study comparing the net energy output of various biofuels. The researchers grew a mixture of native perennial grasses without irrigation, fertilizer, pesticides, or herbicides, in sandy soil that was so depleted by intensive agriculture that it had been abandoned. They measured the usable energy in biofuels made from the grasses, and also from com and soy, then measured the energy it took to grow and produce biofuel from each kind of crop (FIGURE 6.18).
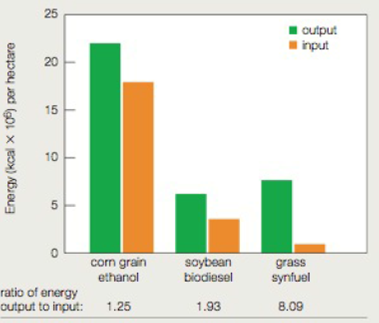
FIGURE 6 .18 Energy inputs and outputs of biofuels made from three different crops. One hectare is about 2 .5 acres.
3. Which of the three crops would require the least amount of land to produce a given amount of biofuel energy?
Want to see the full answer?
Check out a sample textbook solution
Chapter 6 Solutions
Bundle: Biology: The Unity and Diversity of Life, Loose-leaf Version, 14th + LMS Integrated for MindTap Biology, 2 terms (12 months) Printed Access Card


- Which of the following statements about hydration is true? Absence of thirst is a reliable indication that an individual is adequately hydrated. All of these statements are true. Although a popular way to monitor hydration status, weighing yourself before and after intensive physical activity is not a reliable method to monitor hydration. Urine that is the color of apple juice indicates dehydration. I don't know yetarrow_forwardThree of the many recessive mutations in Drosophila melanogaster that affect body color, wing shape, or bristle morphology are black (b) body versus grey in wild type, dumpy (dp), obliquely truncated wings versus long wings in the male, and hooked (hk) bristles versus not hooked in the wild type. From a cross of a dumpy female with a black and hooked male, all of the F1 were wild type for all three of the characters. The testcross of an F1 female with a dumpy, black, hooked male gave the following results: Trait Number of individuals Wild type 169 Black 19 Black, hooked 301 Dumpy, hooked 21 Hooked, dumpy, black 172 Dumpy, black 6 Dumpy 305 Hooked 8 Determine the order of the genes and the mapping distance between genes. Determine the coefficient of confidence for the portion of the chromosome involved in the cross. How much interference takes place in the cross?arrow_forwardWhat happens to a microbes membrane at colder temperature?arrow_forward
- Genes at loci f, m, and w are linked, but their order is unknown. The F1 heterozygotes from a cross of FFMMWW x ffmmww are test crossed. The most frequent phenotypes in the test cross progeny will be FMW and fmw regardless of what the gene order turns out to be. What classes of testcross progeny (phenotypes) would be least frequent if locus m is in the middle? What classes would be least frequent if locus f is in the middle? What classes would be least frequent if locus w is in the middle?arrow_forward1. In the following illustration of a phospholipid... (Chemistry Primer and Video 2-2, 2-3 and 2-5) a. Label which chains contain saturated fatty acids and non-saturated fatty acids. b. Label all the areas where the following bonds could form with other molecules which are not shown. i. Hydrogen bonds ii. Ionic Bonds iii. Hydrophobic Interactions 12-6 HICIH HICIH HICHH HICHH HICIH OHHHHHHHHHHHHHHHHH C-C-C-C-C-c-c-c-c-c-c-c-c-c-c-c-C-C-H HH H H H H H H H H H H H H H H H H H HO H-C-O H-C-O- O O-P-O-C-H H T HICIH HICIH HICIH HICIH HHHHHHH HICIH HICIH HICIH 0=C HIC -C-C-C-C-C-C-C-C-CC-C-C-C-C-C-C-C-C-H HHHHHHHHH IIIIIIII HHHHHHHH (e-osbiv)arrow_forwardAnswer this as a dental assistant studentarrow_forward
- buatkan judul skripsi tentang parasitologi yang sedang trendinharrow_forwardDental assistantarrow_forwardO Macmillan Learning Glu-His-Trp-Ser-Gly-Leu-Arg-Pro-Gly The pKa values for the peptide's side chains, terminal amino groups, and carboxyl groups are provided in the table. Amino acid Amino pKa Carboxyl pKa Side-chain pKa glutamate 9.60 2.34 histidine 9.17 1.82 4.25 6.00 tryptophan 9.39 2.38 serine 9.15 2.21 glycine 9.60 2.34 leucine 9.60 2.36 arginine 9.04 2.17 12.48 proline 10.96 1.99 Calculate the net charge of the molecule at pH 3. net charge at pH 3: Calculate the net charge of the molecule at pH 8. net charge at pH 8: Calculate the net charge of the molecule at pH 11. net charge at pH 11: Estimate the isoelectric point (pl) for this peptide. pl:arrow_forward
- Biology Questionarrow_forwardThis entire structure (Pinus pollen cone) using lifecycle terminology is called what?arrow_forwardThis entire structure using lifecycle terminology is called what? megastrobilus microstrobilus megasporophyll microsporophyll microsporangium megasporangium none of thesearrow_forward

 Biology: The Unity and Diversity of Life (MindTap...BiologyISBN:9781305073951Author:Cecie Starr, Ralph Taggart, Christine Evers, Lisa StarrPublisher:Cengage Learning
 Biology: The Unity and Diversity of Life (MindTap...BiologyISBN:9781337408332Author:Cecie Starr, Ralph Taggart, Christine Evers, Lisa StarrPublisher:Cengage Learning
 Biology 2eBiologyISBN:9781947172517Author:Matthew Douglas, Jung Choi, Mary Ann ClarkPublisher:OpenStax