
Concept explainers
Videos
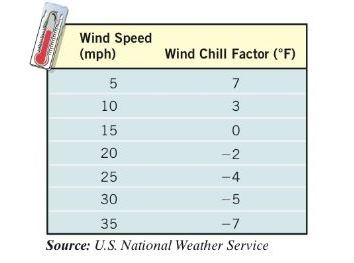
Spreading of a Disease Jack and Diane live in a small town of 50 people. Unfortunately, both Jack and Diane have a cold. Those who come in contact with someone who has this cold will themselves catch the cold. The following data represent the number of people in the small town who have caught the cold after t days.
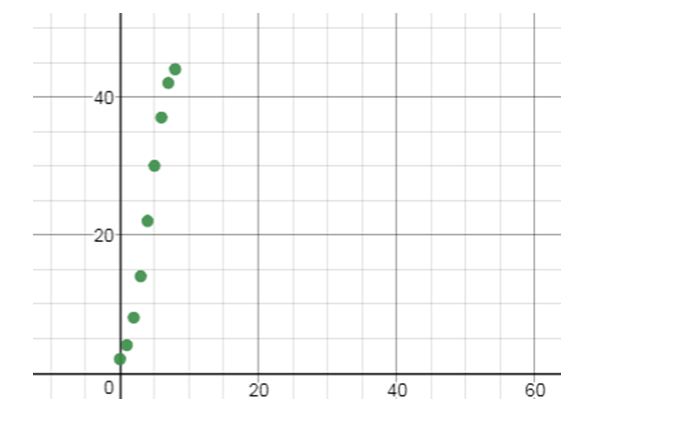
(a) Using a graphing utility, draw a
(b) Using a graphing utility, build a logistic model from the data.
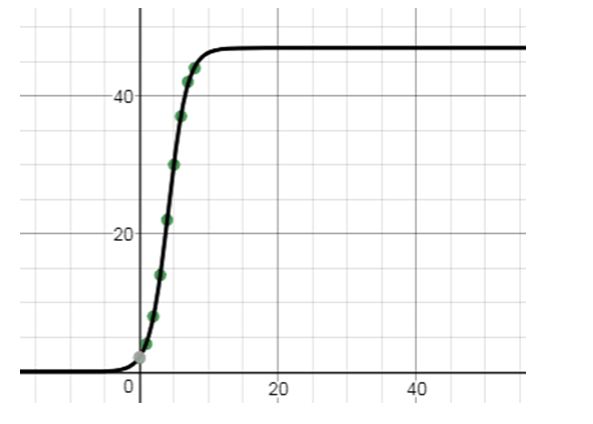
(c) Graph the function found in part (b) on the scatter diagram.
(d) According to the function found in part (b). what is the maximum number of people who will catch the cold? In reality', what is the maximum number of people who could catch the cold?
(e) Sometime between the second and third day, 10 people in the town had a cold. According to the model found in part (b). when did 10 people have a cold?
(f) How long will it take for 46 people to catch the cold?
To find:
a. Using graphing utility, draw a scatter diagram of the data. Comment on the type of relation that appears to exist between the days and number of people with a cold.
Answer to Problem 59RE
a.
Explanation of Solution
Given:
The logistic model.
Calculation:
a. Graph:
To find:
b. Using a graphing utility, build a logistic model from the data.
Answer to Problem 59RE
b.
Explanation of Solution
Given:
The logistic model.
Calculation:
b.
To find:
c. Graph the function found in part (b) on the scatter diagram.
Answer to Problem 59RE
c.
Explanation of Solution
Given:
The logistic model.
Calculation:
c. Scatter diagram.
To find:
d. According to the function found in part(b), what is the maximum number of people who will catch the cold? In reality, what is the maximum number of people who could catch the cold?
Answer to Problem 59RE
d.
Explanation of Solution
Given:
The logistic model.
Calculation:
d.
, the maximum number of people is 50.
To find:
e. Sometime between the second and third day, 10 people in the town had a cold. According to the model found in part(b), when did 10 people have a cold?
Answer to Problem 59RE
e.
Explanation of Solution
Given:
The logistic model.
Calculation:
e.
days, during the tenth hour of day.
To find:
f. How long will it take for 46 people to catch the cold?
Answer to Problem 59RE
f.
Explanation of Solution
Given:
The logistic model.
Calculation:
f.
days.
Chapter 5 Solutions
Precalculus Enhanced with Graphing Utilities
Additional Math Textbook Solutions
Elementary Statistics (13th Edition)
Basic Business Statistics, Student Value Edition
University Calculus: Early Transcendentals (4th Edition)
Elementary Statistics: Picturing the World (7th Edition)
Thinking Mathematically (6th Edition)


- Question 2. i. Suppose that the random variable X takes two possible values 1 and -1, and P(X = 1) = P(X-1)=1/2. Let Y=-X. Are X and Y the same random variable? Do X and Y have the same distribution? Explain your answer. ii. Suppose that the random variable X~N(0, 1), let Y=-X. Are X and Y the same random variable? Do X and Y have the same distribution? Explain your answer.arrow_forwardProblem 4. Let f(x, y) = { Find P(X <1/2|Y = 1/2). c(x + y²) 0arrow_forwardQize f(x) x + 2x2 - 2 x² + 4x² - 4 Solve the equation using Newton Raphsonarrow_forwardSolve please thanks!arrow_forwardSolve please and thank youarrow_forwardAccording to Newton's law of universal gravitation, the force F between two bodies of constant mass GmM m and M is given by the formula F = , where G is the gravitational constant and d is the d² distance between the bodies. a. Suppose that G, m, and M are constants. Find the rate of change of force F with respect to distance d. F' (d) 2GmM b. Find the rate of change of force F with gravitational constant G = 6.67 × 10-¹¹ Nm²/kg², on two bodies 5 meters apart, each with a mass of 250 kilograms. Answer in scientific notation, rounding to 2 decimal places. -6.67x10 N/m syntax incomplete.arrow_forwardSolve please and thank youarrow_forwardmv2 The centripetal force of an object of mass m is given by F (r) = rotation and r is the distance from the center of rotation. ' where v is the speed of r a. Find the rate of change of centripetal force with respect to the distance from the center of rotation. F(r) b. Find the rate of change of centripetal force of an object with mass 500 kilograms, velocity of 13.86 m/s, and a distance from the center of rotation of 300 meters. Round to 2 decimal places. N/m (or kg/s²) F' (300)arrow_forwardSolve work shown please and thanks!arrow_forwardGiven the following graph of the function y = f(x) and n = = 6, answer the following questions about the area under the curve from x graph to enlarge it.) 1 (Round your answer to within two decimal places if necessary, but do not round until your final computation.) a. Use the Trapezoidal Rule to estimate the area. Estimate: T6 G b. Use Simpson's Rule to estimate the area. Estimate: S6 - ID = 0 to x = 6. (Click on aarrow_forward"Solve the following differential equation using the Operator Method and the Determinant Method:" Solve by dr no ai """'+3y"" + 3y+y=arrow_forward(4,4) M -4 2 2 -4 (-4,-4) 4 8 10 12 (8,-4) (12,-4) Graph of f The figure shows the graph of a piecewise-linear function f. For −4≤x≤12, the function g is x defined by g(x) = √ƒ (t)dt . . Find the value of g(6). Find the value of g'(6). |arrow_forwardarrow_back_iosSEE MORE QUESTIONSarrow_forward_ios
 Calculus: Early TranscendentalsCalculusISBN:9781285741550Author:James StewartPublisher:Cengage Learning
 Thomas' Calculus (14th Edition)CalculusISBN:9780134438986Author:Joel R. Hass, Christopher E. Heil, Maurice D. WeirPublisher:PEARSON
 Calculus: Early Transcendentals (3rd Edition)CalculusISBN:9780134763644Author:William L. Briggs, Lyle Cochran, Bernard Gillett, Eric SchulzPublisher:PEARSON
 Calculus: Early TranscendentalsCalculusISBN:9781319050740Author:Jon Rogawski, Colin Adams, Robert FranzosaPublisher:W. H. Freeman
 Calculus: Early Transcendental FunctionsCalculusISBN:9781337552516Author:Ron Larson, Bruce H. EdwardsPublisher:Cengage Learning