
Videos
(a)
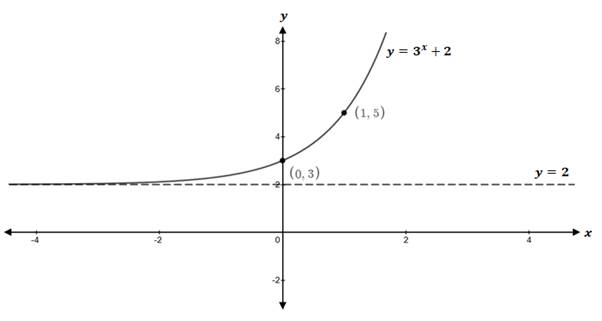
The domain, range and horizontal asymptote of the graph of
(a)
Answer to Problem 12CR
Solution:
Domain of
Range of
Horizontal asymptote is
Graph is:
Explanation of Solution
Given information:
The function
The parent function for the transformation is
The exponential function
Since
Therefore, the graph of function
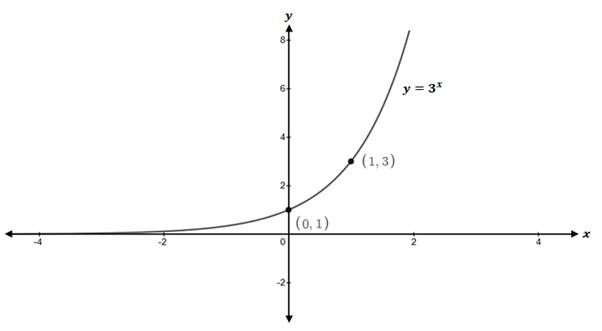
The transformation
To get the graph of
Therefore, the graph of function

Domain of the function is set of all
From graph function,
In an interval notation, the domain of function
Range of function is the set of all
From graph, it is clear that the range of function is the set of all
In an interval notation, the range of function
The line
(b)
The inverse of
(b)
Answer to Problem 12CR
Solution:
The inverse function of
Domain of function
Range of function
Vertical asymptote is line
Explanation of Solution
Given information:
The function
Let
In function
Solve this equation for
Subtract
This can also be written as
Apply logarithm to the base
Apply power rule of logarithm
Apply logarithmic rule
The inverse function is
To check
To check
Using power rule of logarithm,
Since
To check
Apply the rule
So,
Therefore, the inverse function of
Range of function
Since the range of function
Domain of function
Since the domain of function
For logarithmic function
The graph of function
Vertical asymptote of function
Therefore, the vertical asymptote of function
(c)
To graph: The functions
(c)
Explanation of Solution
Given information:
The functions
The graphs of functions
So, the graphs of functions
The function
The function
Therefore, the graph of
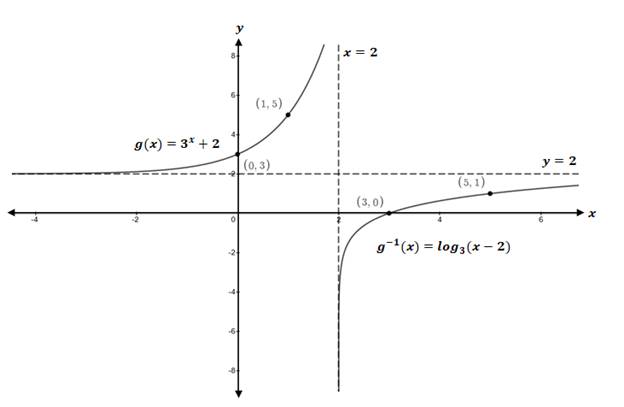
Interpretation:
The graph represents the functions
Chapter 5 Solutions
Precalculus Enhanced with Graphing Utilities
Additional Math Textbook Solutions
University Calculus: Early Transcendentals (4th Edition)
Elementary Statistics (13th Edition)
Calculus: Early Transcendentals (2nd Edition)
College Algebra with Modeling & Visualization (5th Edition)
A Problem Solving Approach To Mathematics For Elementary School Teachers (13th Edition)
Pre-Algebra Student Edition


- Evaluate the double integral ' √ √ (−2xy² + 3ry) dA R where R = {(x,y)| 1 ≤ x ≤ 3, 2 ≤ y ≤ 4} Double Integral Plot of integrand and Region R N 120 100 80- 60- 40 20 -20 -40 2 T 3 4 5123456 This plot is an example of the function over region R. The region and function identified in your problem will be slightly different. Answer = Round your answer to four decimal places.arrow_forwardFind Te²+ dydz 0 Write your answer in exact form.arrow_forwardxy² Find -dA, R = [0,3] × [−4,4] x²+1 Round your answer to four decimal places.arrow_forward
- Find the values of p for which the series is convergent. P-?- ✓ 00 Σ nº (1 + n10)p n = 1 Need Help? Read It Watch It SUBMIT ANSWER [-/4 Points] DETAILS MY NOTES SESSCALCET2 8.3.513.XP. Consider the following series. 00 Σ n = 1 1 6 n° (a) Use the sum of the first 10 terms to estimate the sum of the given series. (Round the answer to six decimal places.) $10 = (b) Improve this estimate using the following inequalities with n = 10. (Round your answers to six decimal places.) Sn + + Los f(x) dx ≤s ≤ S₁ + Jn + 1 + Lo f(x) dx ≤s ≤ (c) Using the Remainder Estimate for the Integral Test, find a value of n that will ensure that the error in the approximation s≈s is less than 0.0000001. On > 11 n> -18 On > 18 On > 0 On > 6 Need Help? Read It Watch Itarrow_forward√5 Find Lª³ L² y-are y- arctan (+) dy dydx. Hint: Use integration by parts. SolidUnderSurface z=y*arctan(1/x) Z1 2 y 1 1 Round your answer to 4 decimal places.arrow_forwardFor the solid lying under the surface z = √√4-² and bounded by the rectangular region R = [0,2]x[0,2] as illustrated in this graph: Double Integral Plot of integrand over Region R 1.5 Z 1- 0.5- 0 0.5 1 1.5 205115 Answer should be in exact math format. For example, some multiple of .arrow_forward
- Find 2 S² 0 0 (4x+2y)5dxdyarrow_forward(14 points) Let S = {(x, y, z) | z = e−(x²+y²), x² + y² ≤ 1}. The surface is the graph of ze(+2) sitting over the unit disk.arrow_forward6. Solve the system of differential equations using Laplace Transforms: x(t) = 3x₁ (t) + 4x2(t) x(t) = -4x₁(t) + 3x2(t) x₁(0) = 1,x2(0) = 0arrow_forward
- 3. Determine the Laplace Transform for the following functions. Show all of your work: 1-t, 0 ≤t<3 a. e(t) = t2, 3≤t<5 4, t≥ 5 b. f(t) = f(tt)e-3(-) cos 4τ drarrow_forward4. Find the inverse Laplace Transform Show all of your work: a. F(s) = = 2s-3 (s²-10s+61)(5-3) se-2s b. G(s) = (s+2)²arrow_forward1. Consider the differential equation, show all of your work: dy =(y2)(y+1) dx a. Determine the equilibrium solutions for the differential equation. b. Where is the differential equation increasing or decreasing? c. Where are the changes in concavity? d. Suppose that y(0)=0, what is the value of y as t goes to infinity?arrow_forward
 Calculus: Early TranscendentalsCalculusISBN:9781285741550Author:James StewartPublisher:Cengage Learning
 Thomas' Calculus (14th Edition)CalculusISBN:9780134438986Author:Joel R. Hass, Christopher E. Heil, Maurice D. WeirPublisher:PEARSON
 Calculus: Early Transcendentals (3rd Edition)CalculusISBN:9780134763644Author:William L. Briggs, Lyle Cochran, Bernard Gillett, Eric SchulzPublisher:PEARSON
 Calculus: Early TranscendentalsCalculusISBN:9781319050740Author:Jon Rogawski, Colin Adams, Robert FranzosaPublisher:W. H. Freeman
 Calculus: Early Transcendental FunctionsCalculusISBN:9781337552516Author:Ron Larson, Bruce H. EdwardsPublisher:Cengage Learning