Concept explainers
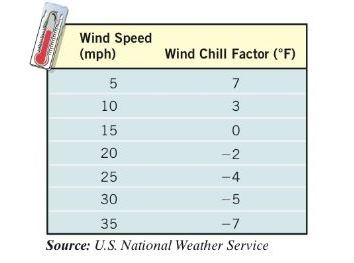
Wind Chill Factor the following data represent the wind speed (mph) and wind chill factor at an air temperature of .

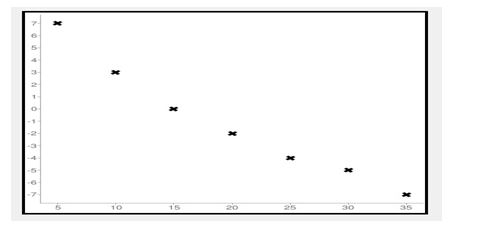
(a) Using a graphing utility, draw a
(b) Using a graphing utility, build a logarithmic model from the data.
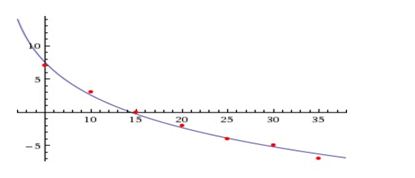
(c) Using a graphing utility, draw the logarithmic function found in part (b) on the scatter diagram.
(d) Use the function found in part (b) to predict the wind chill factor if the air temperature is 15nF and the wind speed is 23 mph.
To find:
a. Using a graphing utility, draw a scatter diagram with wind speed as the independent variable.
Answer to Problem 58RE
a.

Explanation of Solution
Given:
Logarithmic model.
Calculation:
a.

To find:
b. Using a graphing utility, build a logarithmic function found in part (b) on the scatter diagram.
Answer to Problem 58RE
b.
Explanation of Solution
Given:
Logarithmic model.
Calculation:
b.
To find:
c. Using graphing utility, draw the logarithmic function found in part(b) on the scatter diagram.
Answer to Problem 58RE
c.

Explanation of Solution
Given:
Logarithmic model.
Calculation:
c.

To find:
d. Use the function found in part (b) to predict the wind speed is 23 mph.
Answer to Problem 58RE
d.
Explanation of Solution
Given:
Logarithmic model.
Calculation:
d.
Chapter 5 Solutions
Precalculus Enhanced with Graphing Utilities
Additional Math Textbook Solutions
Elementary Statistics: Picturing the World (7th Edition)
Calculus: Early Transcendentals (2nd Edition)
Thinking Mathematically (6th Edition)
University Calculus: Early Transcendentals (4th Edition)
A Problem Solving Approach To Mathematics For Elementary School Teachers (13th Edition)
A First Course in Probability (10th Edition)
- A factorization A = PDP 1 is not unique. For A= 7 2 -4 1 1 1 5 0 2 1 one factorization is P = D= and P-1 30 = Use this information with D₁ = to find a matrix P₁ such that - -1 -2 0 3 1 - - 1 05 A-P,D,P P1 (Type an integer or simplified fraction for each matrix element.)arrow_forwardMatrix A is factored in the form PDP 1. Use the Diagonalization Theorem to find the eigenvalues of A and a basis for each eigenspace. 30 -1 - 1 0 -1 400 0 0 1 A= 3 4 3 0 1 3 040 3 1 3 0 0 4 1 0 0 003 -1 0 -1 Select the correct choice below and fill in the answer boxes to complete your choice. (Use a comma to separate vectors as needed.) A basis for the corresponding eigenspace is { A. There is one distinct eigenvalue, λ = B. In ascending order, the two distinct eigenvalues are λ₁ ... = and 2 = Bases for the corresponding eigenspaces are { and ( ), respectively. C. In ascending order, the three distinct eigenvalues are λ₁ = = 12/2 = and 3 = Bases for the corresponding eigenspaces are {}, }, and { respectively.arrow_forwardN Page 0.6. 0.4. 0.2- -0.2- -0.4- -6.6 -5 W 10arrow_forward
- Diagonalize the following matrix, if possible. 8 0 6 - 8 Select the correct choice below and, if necessary, fill in the answer box to complete your choice. 8 0 OA. For P= D= 0 3 6 0 B. For P = D= 0 -6 8 0 C. For P = D= 0 - 8 D. The matrix cannot be diagonalized.arrow_forwardCalculus lll May I please have the solutions for the following exercises? Thank youarrow_forwardCalculus lll May I please have the solution for the following question? Thank youarrow_forward
- Find three horizontal tangents between [0,10]arrow_forward4 In the integral dxf1dy (7)², make the change of variables x = ½(r− s), y = ½(r + s), and evaluate the integral. Hint: Find the limits on r and s by sketching the area of integration in the (x, y) plane along with the r and s axes, and then show that the same area can be covered by s from 0 to r and r from 0 to 1.arrow_forward7. What are all values of 0, for 0≤0<2л, where 2 sin² 0=-sin? - 5π 6 π (A) 0, л, and 6 7π (B) 0,л, 11π , and 6 6 π 3π π (C) 5π 2 2 3 , and π 3π 2π (D) 2' 2'3 , and 3 4元 3 1 די } I -2m 3 1 -3 บ 1 # 1 I 3# 3m 8. The graph of g is shown above. Which of the following is an expression for g(x)? (A) 1+ tan(x) (B) 1-tan (x) (C) 1-tan (2x) (D) 1-tan + X - 9. The function j is given by j(x)=2(sin x)(cos x)-cos x. Solve j(x) = 0 for values of x in the interval Quiz A: Topic 3.10 Trigonometric Equations and Inequalities Created by Bryan Passwaterarrow_forward
 Calculus: Early TranscendentalsCalculusISBN:9781285741550Author:James StewartPublisher:Cengage Learning
 Thomas' Calculus (14th Edition)CalculusISBN:9780134438986Author:Joel R. Hass, Christopher E. Heil, Maurice D. WeirPublisher:PEARSON
 Calculus: Early Transcendentals (3rd Edition)CalculusISBN:9780134763644Author:William L. Briggs, Lyle Cochran, Bernard Gillett, Eric SchulzPublisher:PEARSON
 Calculus: Early TranscendentalsCalculusISBN:9781319050740Author:Jon Rogawski, Colin Adams, Robert FranzosaPublisher:W. H. Freeman
 Calculus: Early Transcendental FunctionsCalculusISBN:9781337552516Author:Ron Larson, Bruce H. EdwardsPublisher:Cengage Learning


