
Concept explainers
Videos
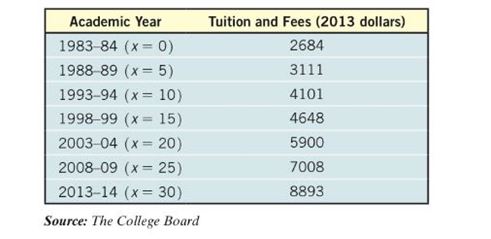
Rising Tuition The following data represent the average in-state tuition and fees (in 2013 dollars) at public four- year colleges and universities in the United States from the academic year 1983 84 to the academic year 2013 14.
(a) Using a graphing utility, draw a
(b) Using a graphing utility, build an exponential model from the data.
(c) Express the function found in part (b) in the form .
(d) Graph the exponential function found in part (b) or (c) on the scatter diagram.
(e) Predict the academic year when the average tuition will reach .
To find:
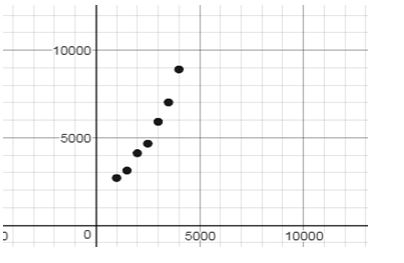
a. Using a graphing utility, draw a scatter diagram with academic year as the independent variable.
Answer to Problem 57RE
a.
Explanation of Solution
Given:
Exponential model.
Calculation:
a. Graph:
To find:
b. Using a graphing utility, build an exponential model from the data.
Answer to Problem 57RE
b.
Explanation of Solution
Given:
Exponential model.
Calculation:
b.
To find:
c. Express the function found in part (b) in the form .
Answer to Problem 57RE
c.
Explanation of Solution
Given:
Exponential model.
Calculation:
c.
To find:
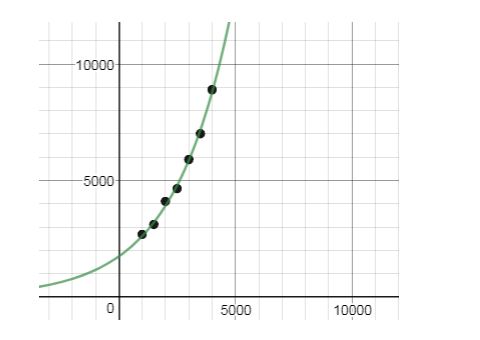
d. Graph the exponential function found in part(b) or (c) on the scatter diagram.
Answer to Problem 57RE
d.
Explanation of Solution
Given:
Exponential model.
Calculation:
d.
To find:
e. Predict the academic year when the average tuition will reach .
Answer to Problem 57RE
e. 2021-22
Explanation of Solution
Given:
Exponential model.
Calculation:
e.
Therefore 2021-22.
Chapter 5 Solutions
Precalculus Enhanced with Graphing Utilities
Additional Math Textbook Solutions
Intro Stats, Books a la Carte Edition (5th Edition)
Pre-Algebra Student Edition
College Algebra (7th Edition)
Algebra and Trigonometry (6th Edition)
Calculus for Business, Economics, Life Sciences, and Social Sciences (14th Edition)


- Solve please thanks!arrow_forwardSolve please and thank youarrow_forwardAccording to Newton's law of universal gravitation, the force F between two bodies of constant mass GmM m and M is given by the formula F = , where G is the gravitational constant and d is the d² distance between the bodies. a. Suppose that G, m, and M are constants. Find the rate of change of force F with respect to distance d. F' (d) 2GmM b. Find the rate of change of force F with gravitational constant G = 6.67 × 10-¹¹ Nm²/kg², on two bodies 5 meters apart, each with a mass of 250 kilograms. Answer in scientific notation, rounding to 2 decimal places. -6.67x10 N/m syntax incomplete.arrow_forward
- Solve please and thank youarrow_forwardmv2 The centripetal force of an object of mass m is given by F (r) = rotation and r is the distance from the center of rotation. ' where v is the speed of r a. Find the rate of change of centripetal force with respect to the distance from the center of rotation. F(r) b. Find the rate of change of centripetal force of an object with mass 500 kilograms, velocity of 13.86 m/s, and a distance from the center of rotation of 300 meters. Round to 2 decimal places. N/m (or kg/s²) F' (300)arrow_forwardSolve work shown please and thanks!arrow_forward
- Given the following graph of the function y = f(x) and n = = 6, answer the following questions about the area under the curve from x graph to enlarge it.) 1 (Round your answer to within two decimal places if necessary, but do not round until your final computation.) a. Use the Trapezoidal Rule to estimate the area. Estimate: T6 G b. Use Simpson's Rule to estimate the area. Estimate: S6 - ID = 0 to x = 6. (Click on aarrow_forward"Solve the following differential equation using the Operator Method and the Determinant Method:" Solve by dr no ai """'+3y"" + 3y+y=arrow_forward(4,4) M -4 2 2 -4 (-4,-4) 4 8 10 12 (8,-4) (12,-4) Graph of f The figure shows the graph of a piecewise-linear function f. For −4≤x≤12, the function g is x defined by g(x) = √ƒ (t)dt . . Find the value of g(6). Find the value of g'(6). |arrow_forward
- PREVIOUS ANSWERS ASK YOUR TEACHER PRACTICE ANOTHER Find the derivative of the function. f'(x) = X x + √3x f(x) = 3x-5 (3√√3x+11√√x+5√3 2√√x (3x-5)² Need Help? Read It SUBMIT ANSWERarrow_forwardPREVIOUS ANSWERS ASK YOUR TEACHER PRACTICE A Find the derivative of the function and evaluate f'(x) at the given val f(x) = (√√√x + 3x) (x3/2 - x); x = 1 f'(x) = 9x 412 (12x (13) 2 - 4x-3√√√x f'(1) = 2 Need Help? Read It Watch It SUBMIT ANSWERarrow_forwardConsider the following functions. g(x) = x + √3x h(x) = 3x-5 x + √3x f(x) = = 3x-5 Find the derivative of each function. g'(x) h'(x) = = f'(x) = 3 = +1 2√3x 3 (3√3x + 10√√x +5√√√3 2√√x (3x-5)² Need Help? Read It SUBMIT ANSWERarrow_forward
 Calculus: Early TranscendentalsCalculusISBN:9781285741550Author:James StewartPublisher:Cengage Learning
 Thomas' Calculus (14th Edition)CalculusISBN:9780134438986Author:Joel R. Hass, Christopher E. Heil, Maurice D. WeirPublisher:PEARSON
 Calculus: Early Transcendentals (3rd Edition)CalculusISBN:9780134763644Author:William L. Briggs, Lyle Cochran, Bernard Gillett, Eric SchulzPublisher:PEARSON
 Calculus: Early TranscendentalsCalculusISBN:9781319050740Author:Jon Rogawski, Colin Adams, Robert FranzosaPublisher:W. H. Freeman
 Calculus: Early Transcendental FunctionsCalculusISBN:9781337552516Author:Ron Larson, Bruce H. EdwardsPublisher:Cengage Learning