
Concept explainers
(a)
Plastic section modulus
Answer to Problem 5.2.1P
The plastic section modulus
Explanation of Solution
Given:
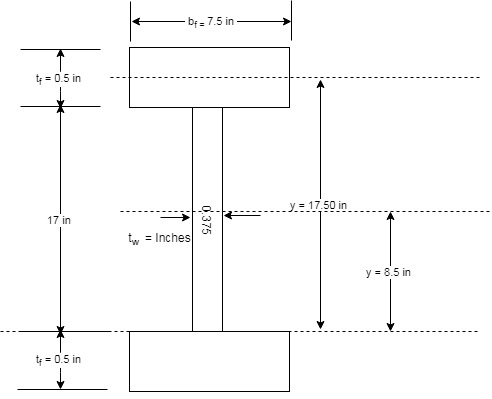
A flexural member is fabricated from two flange plates
Concept used:
The section is a symmetrical section which implies that the plastic neutral axis of the given section is same as the neutral of the given section. Therefore, calculating the lever arm and the centroid of the upper half of the given section, we can find the plastic section modulus.
We have the following figure that will define the terms that we have been given as per the question.

Calculation:
The following is the tabular measurement of every component required:
| Elements | |||||
| Web | |||||
| Flange | |||||
| Sum |
Calculating the centroid of the top half as :
Substitute the values in the above equation.
Now, calculating the moment arm, we have the following formula :
Where, a is the moment arm of the section.
Now, the plastic section modulus can be calculated as follows:
Where, Z is plastic section modulus and A is area.
Calculating the plastic moment as follows:
Substitute the value of
Conclusion:
Therefore, the plastic section modulus
(b)
Elastic section modulus,
Answer to Problem 5.2.1P
The elastic section modulus,
Explanation of Solution
Given:
A flexural member is fabricated from two flange plates
Concept used:
The section is a symmetrical section which implies that the elastic neutral axis of the given section is coinciding with the neutral of the given section. Therefore, calculating the moment of inertia at the major axis using parallel axis theorem, we can find the elastic section modulus.
We have the following figure that will define the terms that we have been given as per the question.
Calculation:
The following is the tabular measurement of every component required:
| Elements | ||||
| Web | ||||
| Top Flange | ||||
| Bottom Flange | ||||
| Sum |
Calculate the Elastic section modulus S with the following formula
Where, C is the distance between the extreme fiber of the section and the neutral axis and is equal to
Here,
By substituting the values in the above equation, we have
Substitute the value of c in the following equation,
Now, calculate the yield moment
Substitute the value of
Conclusion:
Therefore, the elastic section modulus,
Want to see more full solutions like this?
Chapter 5 Solutions
Steel Design (Activate Learning with these NEW titles from Engineering!)


- What are the total earned work hours at completion for the column forms?arrow_forward6000 units have been installed to date with 9,000 units to install. Labor costs are $23,300.00 to date. What is the unit cost for labor to date?arrow_forwardThe base rate for labor is $15/hr. The labor burden is 35% and 3% for small tools for the labor. There are 1000 units to install. Records indicate that trade workers can install 10 units per hour, per trade worker. The owners need 15% overhead and profit to pay bills, pay interest on loan and provide some profit to the partners. What is the minimum bid assuming no risk avoidance factor?arrow_forward
- 5. (20 Points) Consider a channel width change in the same 7-foot wide rectangular in Problem 4. The horizontal channel narrows as depicted below. The flow rate is 90 cfs, and the energy loss (headloss) through the transition is 0.05 feet. The water depth at the entrance to the transition is initially 4'. 1 b₁ TOTAL ENERGY LINE V² 129 У1 I b₂ TOP VIEW 2 PROFILE VIEW h₁ = 0.05 EGL Y₂ = ? a) b) c) 2 Determine the width, b₂ that will cause a choke at location 2. Determine the water depth at the downstream end of the channel transition (y₂) section if b₂ = 5 feet. Calculate the change in water level after the transition. Plot the specific energy diagram showing all key points. Provide printout in homework. d) What will occur if b₂ = = 1.5 ft.?arrow_forward4. (20 Points) A transition section has been proposed to raise the bed level a height Dz in a 7-foot wide rectangular channel. The design flow rate in the channel is 90 cfs, and the energy loss (headloss) through the transition is 0.05 feet. The water depth at the entrance to the transition section is initially 4 feet. b₁ = b = b2 1 TOTAL ENERGY LINE V² 129 Ут TOP VIEW 2 hloss = 0.05 " EGL Y₂ = ? PROFILE VIEW a) Determine the minimum bed level rise, Dz, which will choke the flow. b) If the step height, Dz = 1 ft, determine the water depth (y2) at the downstream end of the channel transition section. Calculate the amount the water level drops or rises over the step. c) Plot the specific energy diagram showing all key points. Provide printout in Bework. d) What will occur if Dz = 3.0 ft.?. Crest Front Viewarrow_forward1. (20 Points) Determine the critical depth in the trapezoidal drainage ditch shown below. The slope of the ditch is 0.0016, the side slopes are 1V:2.5H, the bottom width is b = 14', and the design discharge is 500 cfs. At this discharge the depth is y = 4.25'. Also, determine the flow regime and calculate the Froude number. Ye= ? Z barrow_forward
 Steel Design (Activate Learning with these NEW ti...Civil EngineeringISBN:9781337094740Author:Segui, William T.Publisher:Cengage Learning
 Materials Science And Engineering PropertiesCivil EngineeringISBN:9781111988609Author:Charles GilmorePublisher:Cengage Learning
 Principles of Foundation Engineering (MindTap Cou...Civil EngineeringISBN:9781337705028Author:Braja M. Das, Nagaratnam SivakuganPublisher:Cengage Learning
 Solid Waste EngineeringCivil EngineeringISBN:9781305635203Author:Worrell, William A.Publisher:Cengage Learning,