
Elementary Statistics (Text Only)
2nd Edition
ISBN: 9780077836351
Author: Author
Publisher: McGraw Hill
expand_more
expand_more
format_list_bulleted
Concept explainers
Videos
Textbook Question
Chapter 4.2, Problem 32E
Interpreting technology: The following MINITAB output presents the least-squares regression he for predicting the score on a final exam from the score on a midterm exam.
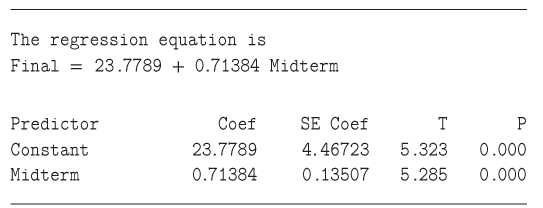
- Write the equation of the least-squares regression line.
- Predict the final exam score for a student who scored 75 on the midterm.
Expert Solution & Answer
Want to see the full answer?
Check out a sample textbook solution
Students have asked these similar questions
NC Current Students - North Ce X | NC Canvas Login Links - North ( X
Final Exam Comprehensive x Cengage Learning
x
WASTAT - Final Exam - STAT
→
C
webassign.net/web/Student/Assignment-Responses/submit?dep=36055360&tags=autosave#question3659890_9
Part (b)
Draw a scatter plot of the ordered pairs.
N
Life
Expectancy
Life
Expectancy
80
70
600
50
40
30
20
10
Year of
1950
1970 1990
2010 Birth
O
Life
Expectancy
Part (c)
800
70
60
50
40
30
20
10
1950
1970 1990
W
ALT
林
$
#
4
R
J7
Year of
2010 Birth
F6
4+
80
70
60
50
40
30
20
10
Year of
1950 1970 1990
2010 Birth
Life
Expectancy
Ox
800
70
60
50
40
30
20
10
Year of
1950 1970 1990 2010 Birth
hp
P.B.
KA
&
7
80
% 5
H
A
B
F10
711
N
M
K
744
PRT SC
ALT
CTRL
Harvard University
California Institute of Technology
Massachusetts Institute of Technology
Stanford University
Princeton University
University of Cambridge
University of Oxford
University of California, Berkeley
Imperial College London
Yale University
University of California, Los Angeles
University of Chicago
Johns Hopkins University
Cornell University
ETH Zurich
University of Michigan
University of Toronto
Columbia University
University of Pennsylvania
Carnegie Mellon University
University of Hong Kong
University College London
University of Washington
Duke University
Northwestern University
University of Tokyo
Georgia Institute of Technology
Pohang University of Science and Technology
University of California, Santa Barbara
University of British Columbia
University of North Carolina at Chapel Hill
University of California, San Diego
University of Illinois at Urbana-Champaign
National University of Singapore
McGill…
Name
Harvard University
California Institute of Technology
Massachusetts Institute of Technology
Stanford University
Princeton University
University of Cambridge
University of Oxford
University of California, Berkeley
Imperial College London
Yale University
University of California, Los Angeles
University of Chicago
Johns Hopkins University
Cornell University
ETH Zurich
University of Michigan
University of Toronto
Columbia University
University of Pennsylvania
Carnegie Mellon University
University of Hong Kong
University College London
University of Washington
Duke University
Northwestern University
University of Tokyo
Georgia Institute of Technology
Pohang University of Science and Technology
University of California, Santa Barbara
University of British Columbia
University of North Carolina at Chapel Hill
University of California, San Diego
University of Illinois at Urbana-Champaign
National University of Singapore…
Chapter 4 Solutions
Elementary Statistics (Text Only)
Ch. 4.1 - In Exercises 9-12, fill in each blank with the...Ch. 4.1 - In Exercises 9-12, fill in each blank with the...Ch. 4.1 - In Exercises 9-12, fill in each blank with the...Ch. 4.1 - In Exercises 9-12, fill in each blank with the...Ch. 4.1 - Prob. 13ECh. 4.1 - Prob. 14ECh. 4.1 - In Exercises 13-16, determine whether the...Ch. 4.1 - In Exercises 13-16, determine whether the...Ch. 4.1 - In Exercises 17-20, compute the correlation...Ch. 4.1 - In Exercises 17-20, compute the correlation...
Ch. 4.1 - In Exercises 17-20, compute the correlation...Ch. 4.1 - In Exercises 17-20, compute the correlation...Ch. 4.1 - In Exercises 21-24, determine whether the...Ch. 4.1 - In Exercises 21-24, determine whether the...Ch. 4.1 - In Exercises 21-24, determine whether the...Ch. 4.1 - In Exercises 21-24, determine whether the...Ch. 4.1 - In Exercises 25-30, determine whether the...Ch. 4.1 - In Exercises 25-30, determine whether the...Ch. 4.1 - In Exercises 25-30, determine whether the...Ch. 4.1 - In Exercises 25-30, determine whether the...Ch. 4.1 - In Exercises 25-30, determine whether the...Ch. 4.1 - In Exercises 25-30, determine whether the...Ch. 4.1 - Price of eggs and milk: The following table...Ch. 4.1 - Government funding: The following table presents...Ch. 4.1 - Pass the ball: The NFL Scouting Combine is an...Ch. 4.1 - Carbon footprint: Carbon dioxide (co2) is produced...Ch. 4.1 - Prob. 35ECh. 4.1 - Prob. 36ECh. 4.1 - Blood pressure: A blood pressure measurement...Ch. 4.1 - Prob. 38ECh. 4.1 - Police and crime: In a survey of cities in the...Ch. 4.1 - Age and education: A survey of U.S. adults showed...Ch. 4.1 - Whats the correlation? In a sample of adults, the...Ch. 4.1 - Prob. 42ECh. 4.1 - Changing means and standard deviations: A small...Ch. 4.2 - In Exercises 5-7, fill in each blank with the...Ch. 4.2 - In Exercises 5-7, fill in each blank with the...Ch. 4.2 - In Exercises 5-7, fill in each blank with the...Ch. 4.2 - Prob. 8ECh. 4.2 - Prob. 9ECh. 4.2 - Prob. 10ECh. 4.2 - Prob. 11ECh. 4.2 - Prob. 12ECh. 4.2 - In Exercises 13-16, compute the least-squares...Ch. 4.2 - In Exercises 13-16, compute the least-squares...Ch. 4.2 - In Exercises 13-16, compute the least-squares...Ch. 4.2 - In Exercises 13-16, compute the least-squares...Ch. 4.2 - Compute the least-squares regression he for...Ch. 4.2 - Compute the least-squares regression he for...Ch. 4.2 - In a hypothetical study of the relationship...Ch. 4.2 - Assume in a study of educational level in years...Ch. 4.2 - Prices of egg and milk: The following table...Ch. 4.2 - Prob. 22ECh. 4.2 - Pass the ball: The NFL Scouting Combine is an...Ch. 4.2 - Carbon footprint: Carbon dioxide (CO2) is produced...Ch. 4.2 - Foot temperatures: Foot ulcers are a common...Ch. 4.2 - Mortgage payments: The following table presents...Ch. 4.2 - Blood pressure: A blood pressure measurement...Ch. 4.2 - Butterfly wings: Do larger butterflies live...Ch. 4.2 - Interpreting technology: The following display...Ch. 4.2 - Interpreting technology: The following display...Ch. 4.2 - Interpreting technology: The following MINITAB...Ch. 4.2 - Interpreting technology: The following MINITAB...Ch. 4.2 - Prob. 33ECh. 4.2 - Prob. 34ECh. 4.2 - Least-squares regression line for z-scores: The...Ch. 4.3 - In Exercises 5-10, fill in each blank with the...Ch. 4.3 - In Exercises 5-10, fill in each blank with the...Ch. 4.3 - In Exercises 5-10, fill in each blank with the...Ch. 4.3 - In Exercises 5-10, fill in each blank with the...Ch. 4.3 - In Exercises 5-10, fill in each blank with the...Ch. 4.3 - Prob. 10ECh. 4.3 - Prob. 11ECh. 4.3 - In Exercises 11-14, determine whether the...Ch. 4.3 - Prob. 13ECh. 4.3 - In Exercises 11-14, determine whether the...Ch. 4.3 - For the following data set: Compute the...Ch. 4.3 - For the following data set: Compute the...Ch. 4.3 - For the following data set: Compute the...Ch. 4.3 - For the following data set: Compute the...Ch. 4.3 - Prob. 19ECh. 4.3 - Prob. 20ECh. 4.3 - Prob. 21ECh. 4.3 - Prob. 22ECh. 4.3 - Prob. 23ECh. 4.3 - Prob. 24ECh. 4.3 - Mutant genes: In a study to determine whether the...Ch. 4.3 - Imports and exports: The following table presents...Ch. 4.3 - Energy consumption: The following table presents...Ch. 4.3 - Cost of health care: The following table presents...Ch. 4.3 - Prob. 29ECh. 4.3 - Broadway: The following table presents the average...Ch. 4.3 - Prob. 31ECh. 4.3 - Transforming a variable: The following table...Ch. 4.3 - Prob. 33ECh. 4.3 - Prob. 34ECh. 4 - Compute the correlation coefficient for the...Ch. 4 - The number of theaters showing the movie Monsters...Ch. 4 - Use the data in Exercise 2 to compute the...Ch. 4 - A scatterplot has a correlation of r=1. Describe...Ch. 4 - Prob. 5CQCh. 4 - The following table presents the average delay in...Ch. 4 - Use the least-squares regression line computed in...Ch. 4 - Use the least-squares regression line computed in...Ch. 4 - Prob. 9CQCh. 4 - A scatterplot has a least-squares regression line...Ch. 4 - Prob. 11CQCh. 4 - Prob. 12CQCh. 4 - A sample of students was studied to determine the...Ch. 4 - In a scatter-plot; the point (-2, 7) is...Ch. 4 - The correlation coefficient for a data set is...Ch. 4 - Prob. 1RECh. 4 - Prob. 2RECh. 4 - Hows your mileage? Weight (in tons) and fuel...Ch. 4 - Prob. 4RECh. 4 - Energy efficiency: A sample of 10 households was...Ch. 4 - Energy efficiency: Using the data in Exercise 5:...Ch. 4 - Prob. 7RECh. 4 - Prob. 8RECh. 4 - Prob. 9RECh. 4 - Prob. 10RECh. 4 - Baby weights: The average gestational age (time...Ch. 4 - Commute times: Every morning, Tania leaves for...Ch. 4 - Prob. 13RECh. 4 - Prob. 14RECh. 4 - Prob. 15RECh. 4 - Describe an example which two variables are...Ch. 4 - Two variables x and y have a positive association...Ch. 4 - Prob. 3WAICh. 4 - Prob. 4WAICh. 4 - Prob. 5WAICh. 4 - Prob. 6WAICh. 4 - Prob. 7WAICh. 4 - Prob. 8WAICh. 4 - Prob. 9WAICh. 4 - The following table, Reproduce from chapter...Ch. 4 - The following table, Reproduce from chapter...Ch. 4 - The following table. Reproduce from chapter...Ch. 4 - Prob. 4CSCh. 4 - Prob. 5CSCh. 4 - The relationship between inflation and...Ch. 4 - The relationship between inflation and...Ch. 4 - Relationship between inflation and unemployment is...Ch. 4 - Relationship between inflation and unemployment is...Ch. 4 - If we are going to use data from this year to...Ch. 4 - If we are going to use data from this year to...Ch. 4 - Prob. 12CSCh. 4 - Prob. 13CSCh. 4 - Prob. 14CSCh. 4 - Prob. 15CS
Knowledge Booster


Learn more about
Need a deep-dive on the concept behind this application? Look no further. Learn more about this topic, statistics and related others by exploring similar questions and additional content below.Similar questions
- A company found that the daily sales revenue of its flagship product follows a normal distribution with a mean of $4500 and a standard deviation of $450. The company defines a "high-sales day" that is, any day with sales exceeding $4800. please provide a step by step on how to get the answers in excel Q: What percentage of days can the company expect to have "high-sales days" or sales greater than $4800? Q: What is the sales revenue threshold for the bottom 10% of days? (please note that 10% refers to the probability/area under bell curve towards the lower tail of bell curve) Provide answers in the yellow cellsarrow_forwardFind the critical value for a left-tailed test using the F distribution with a 0.025, degrees of freedom in the numerator=12, and degrees of freedom in the denominator = 50. A portion of the table of critical values of the F-distribution is provided. Click the icon to view the partial table of critical values of the F-distribution. What is the critical value? (Round to two decimal places as needed.)arrow_forwardA retail store manager claims that the average daily sales of the store are $1,500. You aim to test whether the actual average daily sales differ significantly from this claimed value. You can provide your answer by inserting a text box and the answer must include: Null hypothesis, Alternative hypothesis, Show answer (output table/summary table), and Conclusion based on the P value. Showing the calculation is a must. If calculation is missing,so please provide a step by step on the answers Numerical answers in the yellow cellsarrow_forward
arrow_back_ios
SEE MORE QUESTIONS
arrow_forward_ios
Recommended textbooks for you

 Glencoe Algebra 1, Student Edition, 9780079039897...AlgebraISBN:9780079039897Author:CarterPublisher:McGraw Hill
 Elementary Linear Algebra (MindTap Course List)AlgebraISBN:9781305658004Author:Ron LarsonPublisher:Cengage Learning
 Functions and Change: A Modeling Approach to Coll...AlgebraISBN:9781337111348Author:Bruce Crauder, Benny Evans, Alan NoellPublisher:Cengage Learning
 Big Ideas Math A Bridge To Success Algebra 1: Stu...AlgebraISBN:9781680331141Author:HOUGHTON MIFFLIN HARCOURTPublisher:Houghton Mifflin Harcourt
 Algebra and Trigonometry (MindTap Course List)AlgebraISBN:9781305071742Author:James Stewart, Lothar Redlin, Saleem WatsonPublisher:Cengage Learning
Glencoe Algebra 1, Student Edition, 9780079039897...
Algebra
ISBN:9780079039897
Author:Carter
Publisher:McGraw Hill
Elementary Linear Algebra (MindTap Course List)
Algebra
ISBN:9781305658004
Author:Ron Larson
Publisher:Cengage Learning
Functions and Change: A Modeling Approach to Coll...
Algebra
ISBN:9781337111348
Author:Bruce Crauder, Benny Evans, Alan Noell
Publisher:Cengage Learning
Big Ideas Math A Bridge To Success Algebra 1: Stu...
Algebra
ISBN:9781680331141
Author:HOUGHTON MIFFLIN HARCOURT
Publisher:Houghton Mifflin Harcourt
Algebra and Trigonometry (MindTap Course List)
Algebra
ISBN:9781305071742
Author:James Stewart, Lothar Redlin, Saleem Watson
Publisher:Cengage Learning
Correlation Vs Regression: Difference Between them with definition & Comparison Chart; Author: Key Differences;https://www.youtube.com/watch?v=Ou2QGSJVd0U;License: Standard YouTube License, CC-BY
Correlation and Regression: Concepts with Illustrative examples; Author: LEARN & APPLY : Lean and Six Sigma;https://www.youtube.com/watch?v=xTpHD5WLuoA;License: Standard YouTube License, CC-BY