
Concept explainers
Videos
Compute the
To compute the correlation coefficient for the given data
Answer to Problem 1CQ
The correlation coefficient is
Explanation of Solution
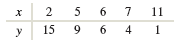
Given:
| x | 2 | 5 | 6 | 7 | 11 |
| y | 15 | 9 | 6 | 4 | 1 |
Concept used:
The correlation coefficient
First we find the sample means
Now to find standard deviations, we construct the table as shown below:
| 2 | 15 | 17.64 | 64 |
| 5 | 9 | 1.44 | 4 |
| 6 | 6 | 0.04 | 1 |
| 7 | 4 | 0.64 | 9 |
| 11 | 1 | 23.04 | 36 |
Therefore, standard deviations are,
Now to find correlation coefficient, we construct the table as shown below:
| 2 | 15 | 1.4985482 | ||
| 5 | 9 | 0.3746370 | ||
| 6 | 6 | 0.0114532 | ||
| 7 | 4 | 0.2445735 | ||
| 11 | 1 | 1.4674411 | ||
= |
Therefore,
Want to see more full solutions like this?
Chapter 4 Solutions
Elementary Statistics (Text Only)


- 18 Using the results from the rainfall versus corn production data in Question 14, answer DOV 15 the following: a. Find and interpret the slope in the con- text of this problem. 79 b. Find the Y-intercept in the context of this problem. alb to sig c. Can the Y-intercept be interpreted here? (.ob or grinisiques xs as 101 gniwollol edt 958 orb sz) asiques sich ed: flow wo PEMAIarrow_forwardVariable Total score (Y) Putts hit (X) Mean. 93.900 35.780 Standard Deviation 7.717 4.554 Correlation 0.896arrow_forward17 Referring to the figures and tables from the golf data in Questions 3 and 13, what hap- pens as you keep increasing X? Does Y increase forever? Explain. comis word ே om zol 6 svari woy wol visy alto su and vibed si s'ablow it bas akiog vino b tad) beil Bopara Aon csu How wod griz -do 30 義arrow_forward
- Variable Temperature (X) Coffees sold (Y) Mean 35.08 29,913 Standard Deviation 16.29 12,174 Correlation -0.741arrow_forward13 A golf analyst measures the total score and number of putts hit for 100 rounds of golf an amateur plays; you can see the summary of statistics in the following table. (See the figure in Question 3 for a scatterplot of this data.)noitoloqpics bella a. Is it reasonable to use a line to fit this data? Explain. 101 250 b. Find the equation of the best fitting 15er regression line. ad aufstuess som 'moob Y lo esulav in X ni ognado a tad Variable on Mean Standard Correlation 92 Deviation Total score (Y) 93.900 7.717 0.896 Putts hit (X) 35.780 4.554 totenololbenq axlam riso voy X to asulisy datdw gribol anil er 08,080.0 zl noitsism.A How atharrow_forwardVariable Bone loss (Y) Age (X) Mean 35.008. 67.992 Standard Deviation 7.684 10.673 Correlation 0.574arrow_forward
- 50 Bone Loss 30 40 20 Scatterplot of Bone Loss vs. Age . [902) 10 50 60 70 80 90 Age a sub adi u xinq (20) E 4 adw I- nyd med ivia .0 What does a scatterplot that shows no linear relationship between X and Y look like?arrow_forwardVariable Temperature (X) Coffees sold (Y) Mean 35.08 29,913 Standard Deviation 16.29 12,174 Correlation -0.741arrow_forward2 Find and interpret the value of r² for the rainfall versus corn data, using the table from Question 14.2291992 b sgen gnome vixists 992 ms up? 2910 1999 bio .blos estos $22 tolqis2 qs rieds ni zoti swoH iisqa vilsen od 1'meo DOV to mogers boangas mus jil Reustar enou Leption20th ) abnuin Hagodt graub 032 Carrow_forward
- 18 Using the results from the rainfall versus corn production data in Question 14, answer oy the following: DOY 98 103 LA Find and interpret the slope in the con- text of this problem. b. Find the Y-intercept in the context of this problem. roy gatiigisve Toy c. Can the Y-intercept be interpreted here? (.ob o grinisq blo eiqmaxs as 101 galwollol edt 998 ds most notamotni er griau sib 952) siqmaxs steb godt llaw worl pun MAarrow_forwardVariable mean standard variation correlation temperature(X) 35.08 16.29. -0,741 coffees sold(Y). 29,913. 12.174.arrow_forward12 ம் Y si to no 1672 1 A medical researcher measures bone density and the age of 125 women; you can see the o lesummary of statistics in the following table. (See the figure in Question 2 for a scatterplot of this data.) a. How well will a line fit this data? b. Find the equation of the best fitting regression line. Variable Mean Standard Correlation Deviation Bone loss (Y) 35.008 7.684 0.574 A Age (X) 19 67.992 10.673 T in send art lo (d) sqala sala bolt 3 esmit sqola ad garrow_forward
 Big Ideas Math A Bridge To Success Algebra 1: Stu...AlgebraISBN:9781680331141Author:HOUGHTON MIFFLIN HARCOURTPublisher:Houghton Mifflin Harcourt
 Holt Mcdougal Larson Pre-algebra: Student Edition...AlgebraISBN:9780547587776Author:HOLT MCDOUGALPublisher:HOLT MCDOUGAL
 Glencoe Algebra 1, Student Edition, 9780079039897...AlgebraISBN:9780079039897Author:CarterPublisher:McGraw Hill