
Introduction to Statistics and Data Analysis
5th Edition
ISBN: 9781305115347
Author: Roxy Peck; Chris Olsen; Jay L. Devore
Publisher: Brooks Cole
expand_more
expand_more
format_list_bulleted
Videos
Textbook Question
Chapter 3.5, Problem 51E
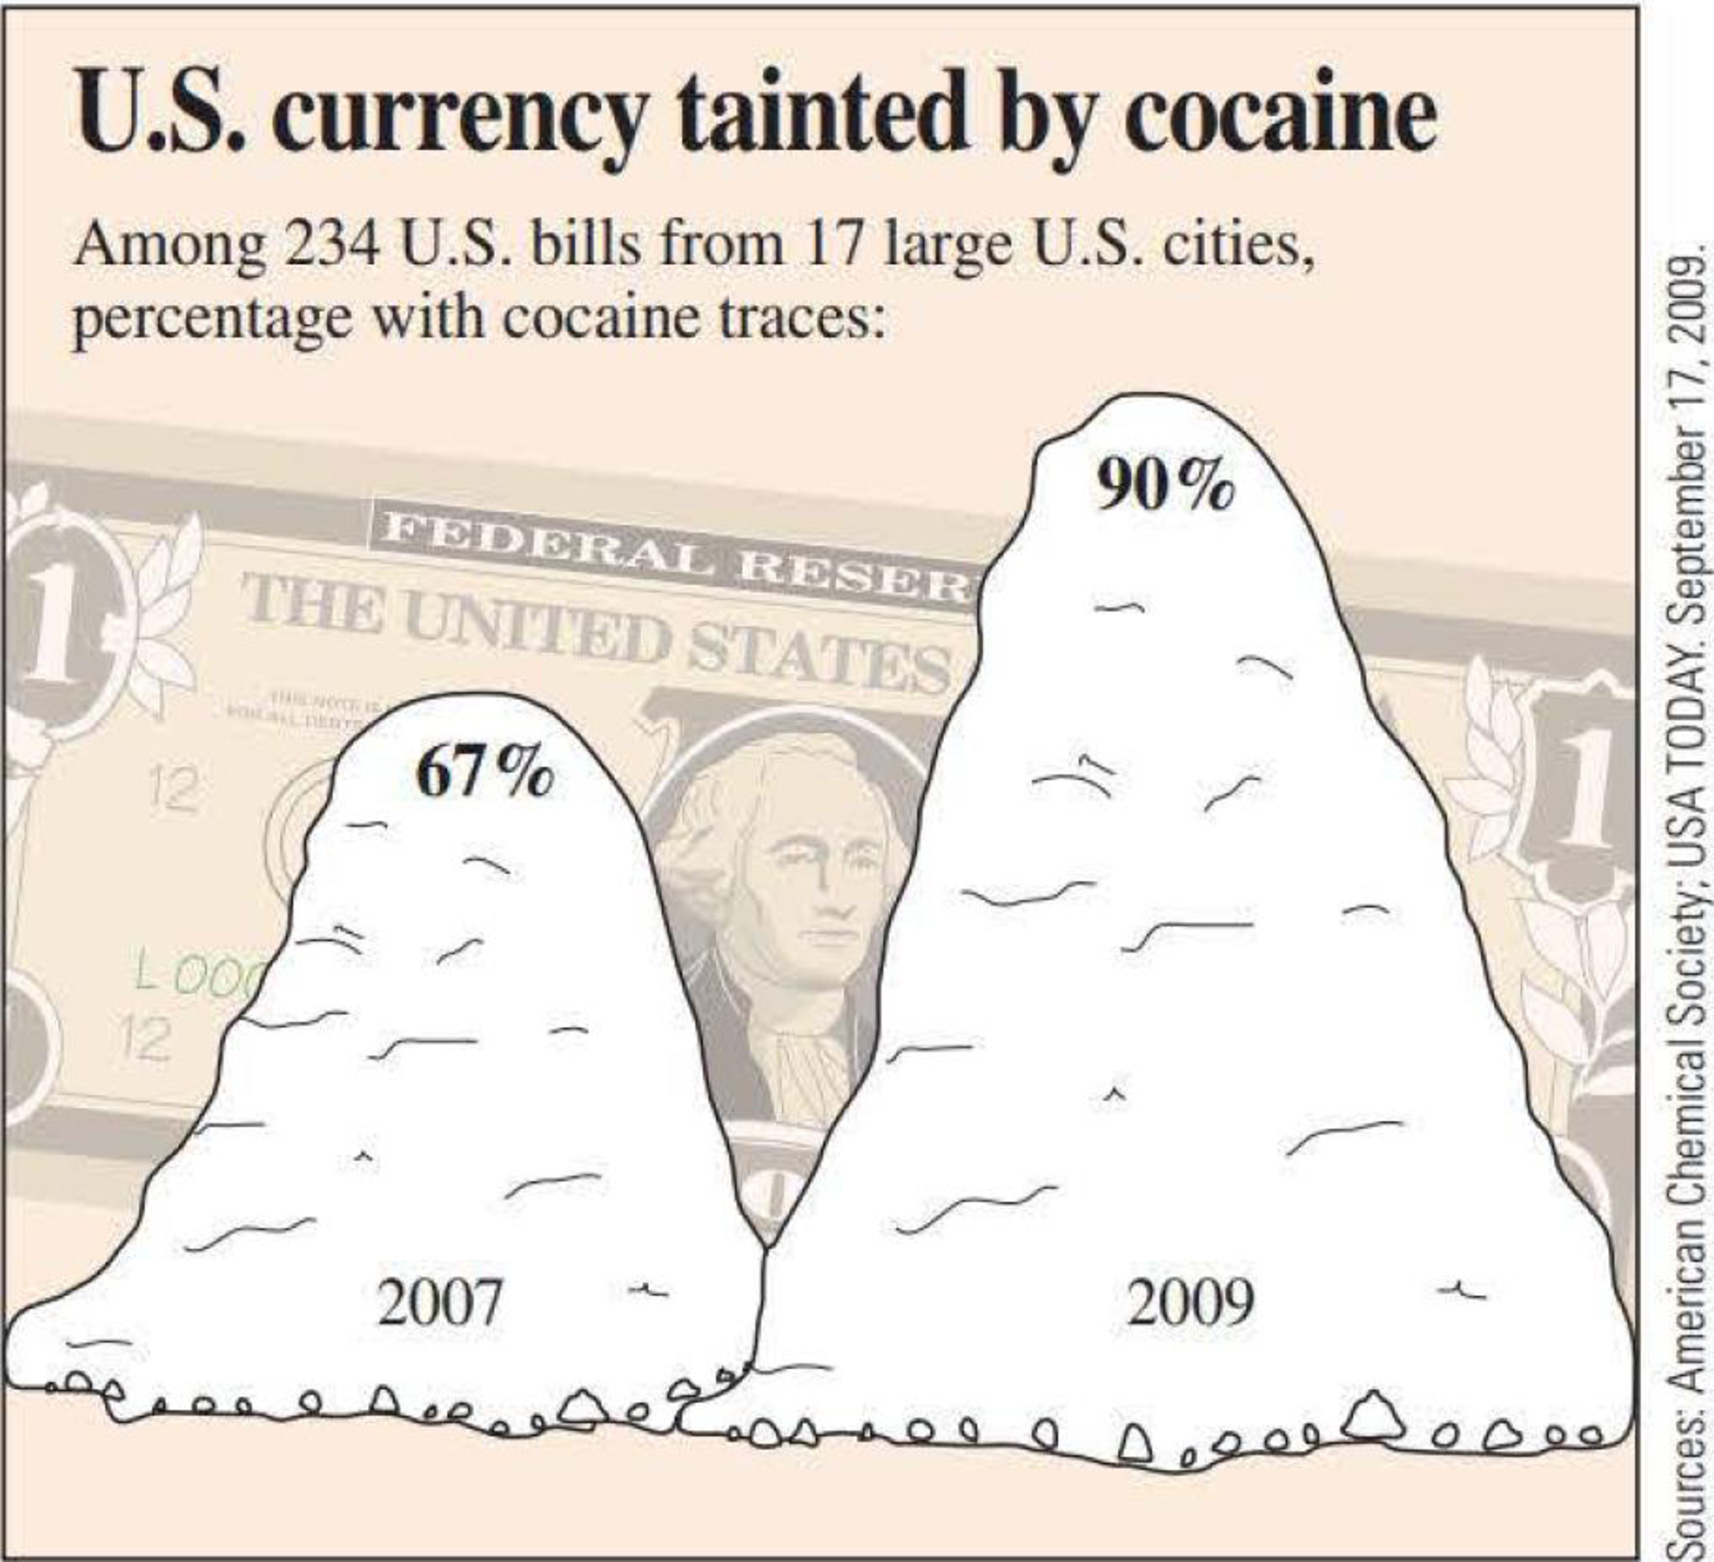
Explain why the following graphical display (similar to one appearing in USA TODAY, September 17, 2009) is misleading.
Expert Solution & Answer
Want to see the full answer?
Check out a sample textbook solution
Students have asked these similar questions
An insurance company hires an actuary to determine whether the number of hours of safety drivingclasses can be used to predict the number of driving accidents for each driver. Identify theexplanatory variable, if any.
Last question: (e) Percentage of viewers who are 35 to 54 or prefer videos on a mobile or laptop device
please answer all of the questions in the pictures!
Chapter 3 Solutions
Introduction to Statistics and Data Analysis
Ch. 3.1 - Each person in a nationally representative sample...Ch. 3.1 - The graphical display on the next page is similar...Ch. 3.1 - Prob. 3ECh. 3.1 - The National Confectioners Association asked 1006...Ch. 3.1 - College student attitudes about e-books were...Ch. 3.1 - Prob. 6ECh. 3.1 - Prob. 7ECh. 3.1 - Prob. 8ECh. 3.1 - Prob. 9ECh. 3.1 - The survey on student attitude toward e-books...
Ch. 3.1 - Prob. 11ECh. 3.1 - Prob. 12ECh. 3.1 - An article about college loans (New Rules Would...Ch. 3.1 - Prob. 14ECh. 3.2 - Prob. 15ECh. 3.2 - Prob. 16ECh. 3.2 - Prob. 17ECh. 3.2 - The article Economy Low, Generosity High (USA...Ch. 3.2 - Prob. 19ECh. 3.2 - A report from Texas Transportation Institute...Ch. 3.2 - The percentage of teens not in school or working...Ch. 3.3 - Prob. 22ECh. 3.3 - The accompanying data on annual maximum wind speed...Ch. 3.3 - The accompanying relative frequency table is based...Ch. 3.3 - Prob. 25ECh. 3.3 - Medicares new medical plans offer a wide range of...Ch. 3.3 - The following two relative frequency distributions...Ch. 3.3 - Prob. 28ECh. 3.3 - The report Trends in College Pricing 2012...Ch. 3.3 - An exam is given to students in an introductory...Ch. 3.3 - The accompanying frequency distribution summarizes...Ch. 3.3 - Example 3.19 used annual rainfall data for...Ch. 3.3 - Prob. 33ECh. 3.3 - Prob. 34ECh. 3.3 - Prob. 35ECh. 3.3 - Prob. 36ECh. 3.3 - Using the five class intervals 100 to 120, 120 to...Ch. 3.4 - Prob. 38ECh. 3.4 - Consumer Reports Health (consumerreports.org) gave...Ch. 3.4 - Prob. 40ECh. 3.4 - Prob. 41ECh. 3.4 - Prob. 42ECh. 3.4 - Prob. 43ECh. 3.4 - Prob. 44ECh. 3.4 - The accompanying time series plot of movie box...Ch. 3.5 - The accompanying comparative bar chart is similar...Ch. 3.5 - Prob. 47ECh. 3.5 - The figure at the top right of the next page is...Ch. 3.5 - The two graphical displays below are similar to...Ch. 3.5 - The following graphical display is similar to one...Ch. 3.5 - Explain why the following graphical display...Ch. 3 - Prob. 52CRCh. 3 - Prob. 53CRCh. 3 - Prob. 54CRCh. 3 - The Connecticut Agricultural Experiment Station...Ch. 3 - The stem-and-leaf display of Exercise 3.55 uses...Ch. 3 - Prob. 57CRCh. 3 - Prob. 58CRCh. 3 - Does the size of a transplanted organ matter? A...Ch. 3 - Prob. 60CRCh. 3 - Prob. 61CRCh. 3 - Prob. 62CRCh. 3 - The article Tobacco and Alcohol Use in G-Rated...Ch. 3 - Prob. 64CRCh. 3 - Prob. 65CRCh. 3 - Prob. 66CRCh. 3 - Prob. 67CRCh. 3 - Prob. 68CRCh. 3 - Prob. 69CRCh. 3 - Many nutritional experts have expressed concern...Ch. 3 - Americium 241 (241Am) is a radioactive material...Ch. 3 - Does eating broccoli reduce the risk of prostate...Ch. 3 - An article that appeared in USA TODAY (August 11,...Ch. 3 - Sometimes samples are composed entirely of...Ch. 3 - Prob. 4CRECh. 3 - More than half of Californias doctors say they are...Ch. 3 - Based on observing more than 400 drivers in the...Ch. 3 - An article from the Associated Press (May 14,...Ch. 3 - Prob. 8CRECh. 3 - Prob. 9CRECh. 3 - Prob. 10CRECh. 3 - The article Determination of Most Representative...Ch. 3 - The paper Lessons from Pacemaker Implantations...Ch. 3 - How does the speed of a runner vary over the...Ch. 3 - Prob. 14CRECh. 3 - One factor in the development of tennis elbow, a...Ch. 3 - An article that appeared in USA TODAY (September...
Additional Math Textbook Solutions
Find more solutions based on key concepts
1. How is a sample related to a population?
Elementary Statistics: Picturing the World (6th Edition)
c
Solve.
70. Copy Center Account. Rachel’s copy-center bill for July was $327. She made a payment of $200 and t...
Developmental Mathematics (9th Edition)
Compare and contrast the nonscientific methods for knowing or acquiring knowledge (tenacity, intuition, authori...
Research Methods for the Behavioral Sciences (MindTap Course List)
Why is it difficult to define quality?
Introduction to Statistical Quality Control
In a test of the quality of two television commercials, each commercial was shown in a separate test area six t...
Statistics for Business & Economics, Revised (MindTap Course List)
Knowledge Booster


Learn more about
Need a deep-dive on the concept behind this application? Look no further. Learn more about this topic, statistics and related others by exploring similar questions and additional content below.Similar questions
- write coal, oil, natural gas or nuclear energyarrow_forwardpart D was marked as wrongarrow_forwardThe Environmental Protection Agency (EPA) uses a measure called the Pollutant Standards Index (PSI) to measure air quality in a city. A PSI reading over 100 indicates a day when the air quality is considered unhealthy. The measurements represent the number of days in 1995 that the PSI was over 100 for twenty metropolitan areas in the U.S. Midwest. 0, 0, 0, 1, 1, 1, 1, 1, 2, 2, 3, 4, 4, 4, 4, 5, 7, 7, 11, 14 Which of the above is the appropriate boxplot for this data?AB C When we drew the boxplot for this data we found no extreme outliers:truefalsearrow_forward
- Please help asap with this. thank you!arrow_forwardhe Environmental Protection Agency (EPA) uses a measure called the Pollutant Standards Index (PSI) to measure air quality in a city. A PSI reading over 100 indicates a day when the air quality is considered unhealthy. The measurements represent the number of days in 1995 that the PSI was over 100 for twenty metropolitan areas in the U.S. Midwest.0, 0, 0, 1, 1, 1, 1, 1, 2, 2, 3, 4, 4, 4, 4, 5, 7, 7, 11, 14A careless employee originally recorded a number that was at least 20 times larger than 14:0, 0, 0, 1, 1, 1, 1, 1, 2, 2, 3, 4, 4, 4, 4, 5, 7, 7, 11, (much larger than 14)The employee's mistake would have the following effect:The median would stay the sameincrease decrease The mean would decreaseincrease stay the same The mode would increasestay the same decrease The IQR would increasedecrease stay the same The standard deviation would decreaseincrease stay the samearrow_forwardAccording to a business report, The mean age of a staff of statistics department is 18.25 years. Some new people with a mean age of 16 years join the department,now the mean age of the department becomes 17 years. Find the number of new people who join the statistics department.arrow_forward
- In your own words, explain what is point estimation and why is it important. Give an examplearrow_forwardApply table to question. Thanks!arrow_forwardA realtor's website provides information on area homes that are for sale, including the following variables: List Price, School District, Size, Style. Refer to the variables provided by the realtor. Identify a question that we might ask about relationships between any two (or more) of these variables.arrow_forward
arrow_back_ios
SEE MORE QUESTIONS
arrow_forward_ios
Recommended textbooks for you
 Elementary Geometry for College StudentsGeometryISBN:9781285195698Author:Daniel C. Alexander, Geralyn M. KoeberleinPublisher:Cengage Learning
 Holt Mcdougal Larson Pre-algebra: Student Edition...AlgebraISBN:9780547587776Author:HOLT MCDOUGALPublisher:HOLT MCDOUGAL
Elementary Geometry for College Students
Geometry
ISBN:9781285195698
Author:Daniel C. Alexander, Geralyn M. Koeberlein
Publisher:Cengage Learning
Holt Mcdougal Larson Pre-algebra: Student Edition...
Algebra
ISBN:9780547587776
Author:HOLT MCDOUGAL
Publisher:HOLT MCDOUGAL
What Are Research Ethics?; Author: HighSchoolScience101;https://www.youtube.com/watch?v=nX4c3V23DZI;License: Standard YouTube License, CC-BY
What is Ethics in Research - ethics in research (research ethics); Author: Chee-Onn Leong;https://www.youtube.com/watch?v=W8Vk0sXtMGU;License: Standard YouTube License, CC-BY