
Videos
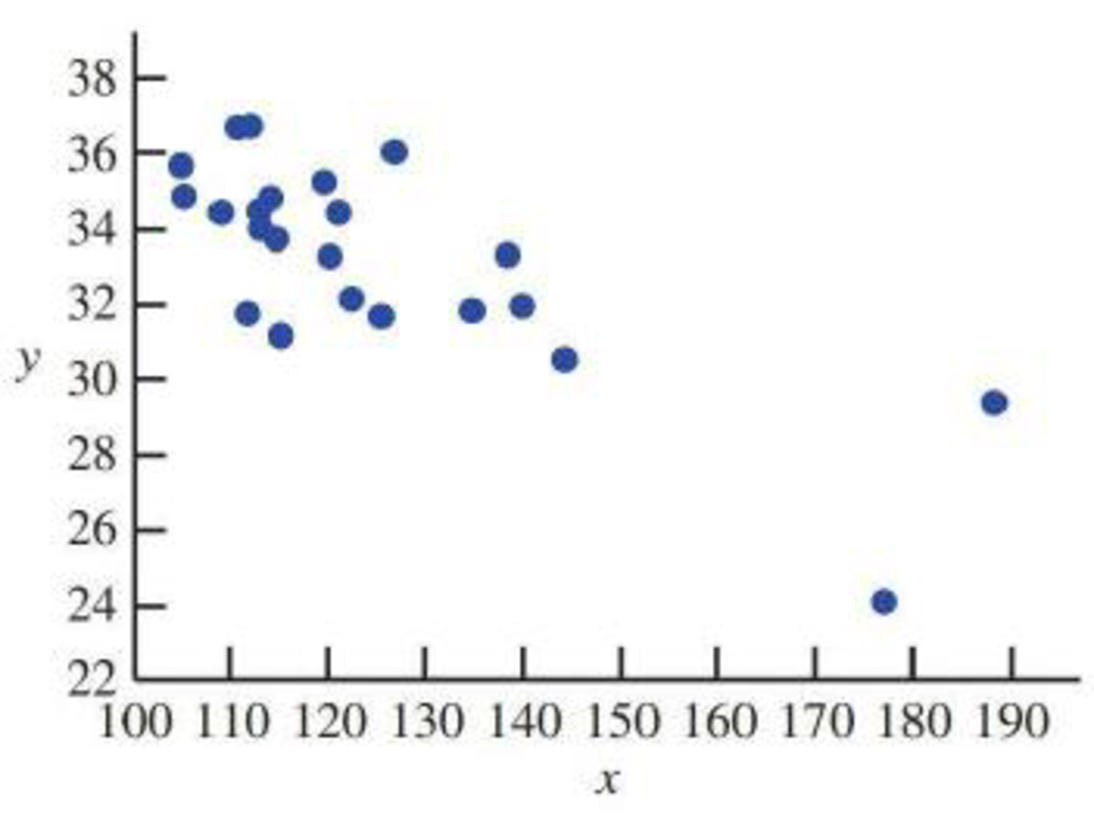
One factor in the development of tennis elbow, a malady that strikes fear into the hearts of all serious players of that sport, is the impact-induced vibration of the racket-and-arm system at ball contact. It is well known that the likelihood of getting tennis elbow depends on various properties of the racket used. Consider the accompanying

Trending nowThis is a popular solution!

Chapter 3 Solutions
Introduction to Statistics and Data Analysis
Additional Math Textbook Solutions
Finite Mathematics for Business, Economics, Life Sciences and Social Sciences
Elementary Statistics ( 3rd International Edition ) Isbn:9781260092561
Elementary Algebra For College Students (10th Edition)
Elementary Statistics: Picturing the World (7th Edition)
Beginning and Intermediate Algebra
College Algebra (Collegiate Math)


- A recent survey of 400 americans asked whether or not parents do too much for their young adult children. The results of the survey are shown in the data file. a) Construct the frequency and relative frequency distributions. How many respondents felt that parents do too much for their adult children? What proportion of respondents felt that parents do too little for their adult children? b) Construct a pie chart. Summarize the findingsarrow_forwardThe average number of minutes Americans commute to work is 27.7 minutes (Sterling's Best Places, April 13, 2012). The average commute time in minutes for 48 cities are as follows: Click on the datafile logo to reference the data. DATA file Albuquerque 23.3 Jacksonville 26.2 Phoenix 28.3 Atlanta 28.3 Kansas City 23.4 Pittsburgh 25.0 Austin 24.6 Las Vegas 28.4 Portland 26.4 Baltimore 32.1 Little Rock 20.1 Providence 23.6 Boston 31.7 Los Angeles 32.2 Richmond 23.4 Charlotte 25.8 Louisville 21.4 Sacramento 25.8 Chicago 38.1 Memphis 23.8 Salt Lake City 20.2 Cincinnati 24.9 Miami 30.7 San Antonio 26.1 Cleveland 26.8 Milwaukee 24.8 San Diego 24.8 Columbus 23.4 Minneapolis 23.6 San Francisco 32.6 Dallas 28.5 Nashville 25.3 San Jose 28.5 Denver 28.1 New Orleans 31.7 Seattle 27.3 Detroit 29.3 New York 43.8 St. Louis 26.8 El Paso 24.4 Oklahoma City 22.0 Tucson 24.0 Fresno 23.0 Orlando 27.1 Tulsa 20.1 Indianapolis 24.8 Philadelphia 34.2 Washington, D.C. 32.8 a. What is the mean commute time for…arrow_forwardMorningstar tracks the total return for a large number of mutual funds. The following table shows the total return and the number of funds for four categories of mutual funds. Click on the datafile logo to reference the data. DATA file Type of Fund Domestic Equity Number of Funds Total Return (%) 9191 4.65 International Equity 2621 18.15 Hybrid 1419 2900 11.36 6.75 Specialty Stock a. Using the number of funds as weights, compute the weighted average total return for these mutual funds. (to 2 decimals) % b. Is there any difficulty associated with using the "number of funds" as the weights in computing the weighted average total return in part (a)? Discuss. What else might be used for weights? The input in the box below will not be graded, but may be reviewed and considered by your instructor. c. Suppose you invested $10,000 in this group of mutual funds and diversified the investment by placing $2000 in Domestic Equity funds, $4000 in International Equity funds, $3000 in Specialty Stock…arrow_forward
- The days to maturity for a sample of five money market funds are shown here. The dollar amounts invested in the funds are provided. Days to Maturity 20 Dollar Value ($ millions) 20 12 30 7 10 5 6 15 10 Use the weighted mean to determine the mean number of days to maturity for dollars invested in these five money market funds (to 1 decimal). daysarrow_forwardc. What are the first and third quartiles? First Quartiles (to 1 decimals) Third Quartiles (to 4 decimals) × ☑ Which companies spend the most money on advertising? Business Insider maintains a list of the top-spending companies. In 2014, Procter & Gamble spent more than any other company, a whopping $5 billion. In second place was Comcast, which spent $3.08 billion (Business Insider website, December 2014). The top 12 companies and the amount each spent on advertising in billions of dollars are as follows. Click on the datafile logo to reference the data. DATA file Company Procter & Gamble Comcast Advertising ($billions) $5.00 3.08 2.91 Company American Express General Motors Advertising ($billions) $2.19 2.15 ETET AT&T Ford Verizon L'Oreal 2.56 2.44 2.34 Toyota Fiat Chrysler Walt Disney Company J.P Morgan a. What is the mean amount spent on advertising? (to 2 decimals) 2.55 b. What is the median amount spent on advertising? (to 3 decimals) 2.09 1.97 1.96 1.88arrow_forwardMartinez Auto Supplies has retail stores located in eight cities in California. The price they charge for a particular product in each city are vary because of differing competitive conditions. For instance, the price they charge for a case of a popular brand of motor oil in each city follows. Also shown are the number of cases that Martinez Auto sold last quarter in each city. City Price ($) Sales (cases) Bakersfield 34.99 501 Los Angeles 38.99 1425 Modesto 36.00 294 Oakland 33.59 882 Sacramento 40.99 715 San Diego 38.59 1088 San Francisco 39.59 1644 San Jose 37.99 819 Compute the average sales price per case for this product during the last quarter? Round your answer to two decimal places.arrow_forward
- Consider the following data and corresponding weights. xi Weight(wi) 3.2 6 2.0 3 2.5 2 5.0 8 a. Compute the weighted mean (to 2 decimals). b. Compute the sample mean of the four data values without weighting. Note the difference in the results provided by the two computations (to 3 decimals).arrow_forwardExpert only,if you don't know it don't attempt it, no Artificial intelligence or screen shot it solvingarrow_forwardFor context, the image provided below is a quesion from a Sepetember, 2024 past paper in statistical modelingarrow_forward
- For context, the images attached below (the question and the related figure) is from a january 2024 past paperarrow_forwardFor context, the image attached below is a question from a June 2024 past paper in statisical modelingarrow_forwardFor context, the images attached below are a question from a June, 2024 past paper in statistical modelingarrow_forward
 Glencoe Algebra 1, Student Edition, 9780079039897...AlgebraISBN:9780079039897Author:CarterPublisher:McGraw Hill
 Trigonometry (MindTap Course List)TrigonometryISBN:9781337278461Author:Ron LarsonPublisher:Cengage Learning
 Linear Algebra: A Modern IntroductionAlgebraISBN:9781285463247Author:David PoolePublisher:Cengage Learning
 Big Ideas Math A Bridge To Success Algebra 1: Stu...AlgebraISBN:9781680331141Author:HOUGHTON MIFFLIN HARCOURTPublisher:Houghton Mifflin Harcourt