
Videos
The accompanying frequency distribution summarizes data on the number of times smokers who had successfully quit smoking attempted to quit before their final successful attempt (“Demographic Variables, Smoking Variables, and Outcome Across Five Studies,” Health Psychology [2007]: 278–287).
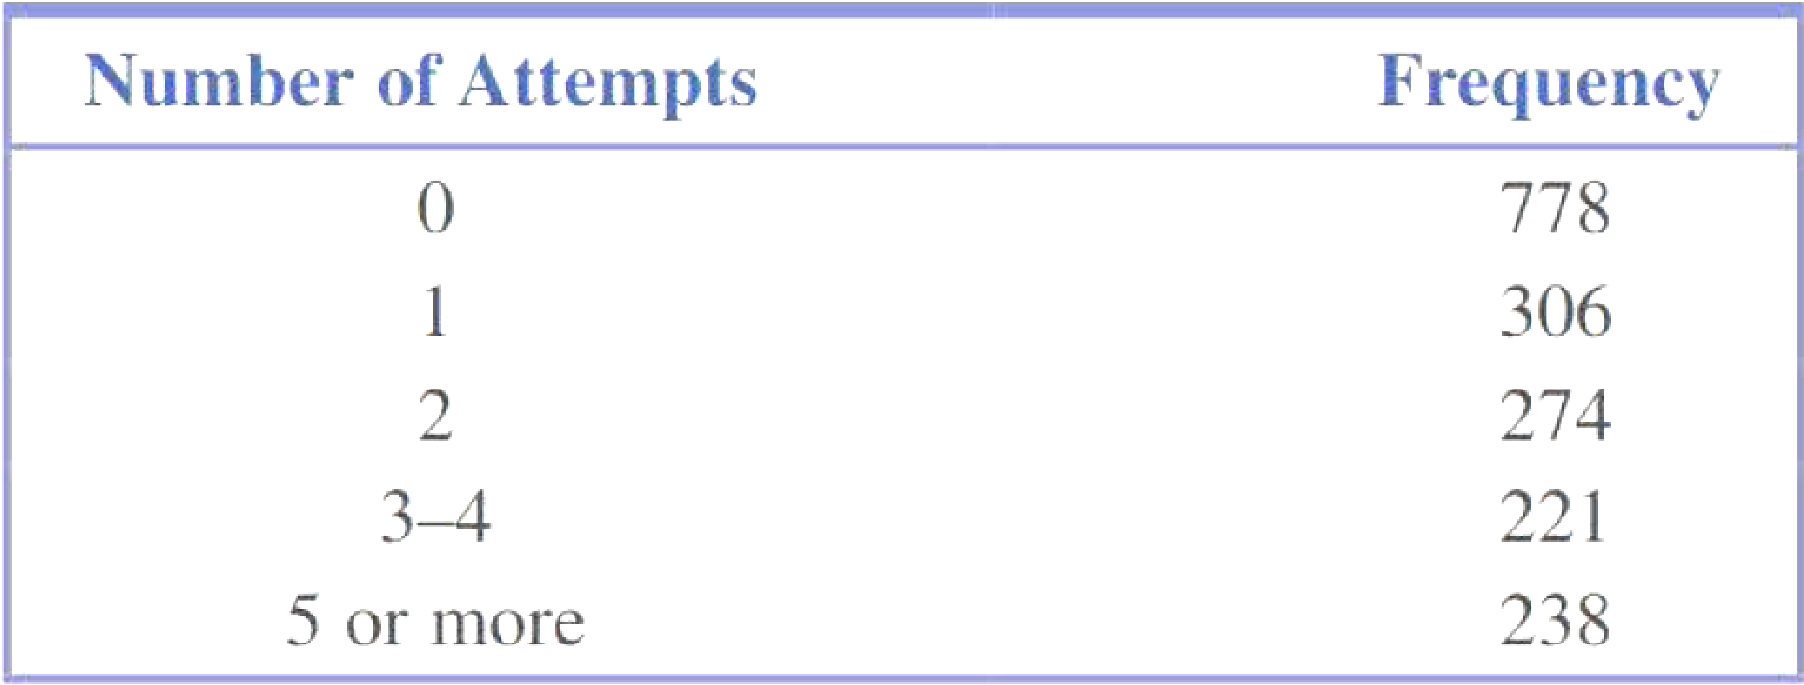
Assume that no one had made more than 10 unsuccessful attempts, so that the last entry in the frequency distribution can be regarded as 5–10 attempts. Summarize this data set using a histogram. Be careful—the class intervals are not all the same width, so a density scale should be used for the histogram. Also remember that for a discrete variable, the bar for 1 will extend from 0.5 to 1.5. Think about what this will mean for the bars for the 3–4 group and the 5–10 group.

Trending nowThis is a popular solution!

Chapter 3 Solutions
Introduction to Statistics and Data Analysis
Additional Math Textbook Solutions
Elementary Statistics ( 3rd International Edition ) Isbn:9781260092561
Statistical Techniques in Business and Economics
Elementary Statistics: A Step By Step Approach
STATISTICS F/BUSINESS+ECONOMICS-TEXT
Elementary Statistics: Picturing the World (7th Edition)
Basic Business Statistics, Student Value Edition


 Glencoe Algebra 1, Student Edition, 9780079039897...AlgebraISBN:9780079039897Author:CarterPublisher:McGraw Hill
 Big Ideas Math A Bridge To Success Algebra 1: Stu...AlgebraISBN:9781680331141Author:HOUGHTON MIFFLIN HARCOURTPublisher:Houghton Mifflin Harcourt
 Holt Mcdougal Larson Pre-algebra: Student Edition...AlgebraISBN:9780547587776Author:HOLT MCDOUGALPublisher:HOLT MCDOUGAL