
Introduction to Statistics and Data Analysis
5th Edition
ISBN: 9781305115347
Author: Roxy Peck; Chris Olsen; Jay L. Devore
Publisher: Brooks Cole
expand_more
expand_more
format_list_bulleted
Videos
Textbook Question
Chapter 3, Problem 16CRE
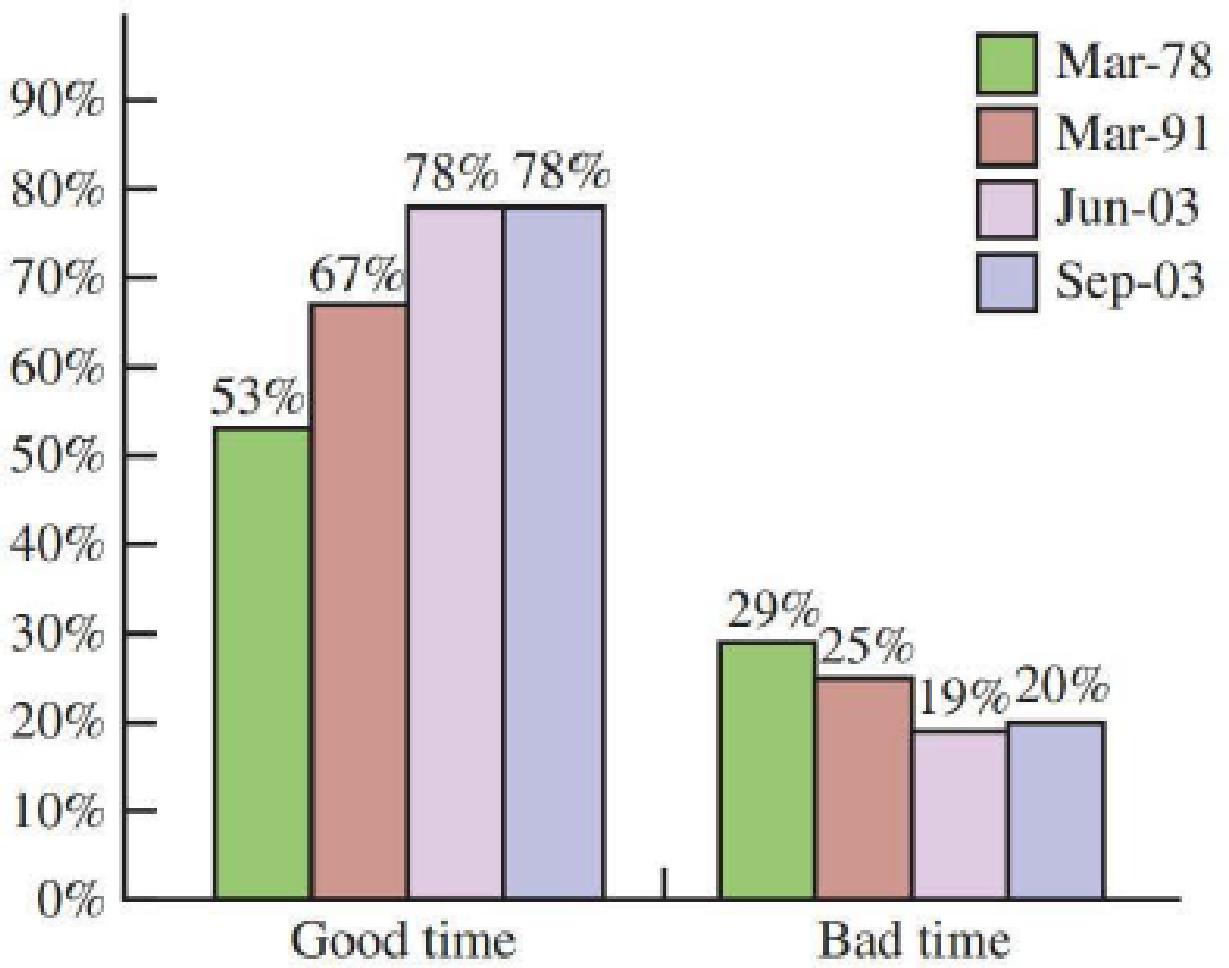
An article that appeared in USA TODAY (September 3, 2003) included a graph similar to the one shown here summarizing responses from polls conducted in 1978, 1991, and 2003 in which a sample of American adults were asked whether or not it was a good time or a bad time to buy a house.
- a. Construct a time series plot that shows how the percentage that thought it was a good time to buy a house has changed over time.
- b. Add a new line to the plot from Part (a) showing the percentage that thought it was a bad time to buy a house over time. Be sure to label the lines clearly.
- c. Which graph, the given bar chart or the time series plot, best shows the trend over time?
Expert Solution & Answer
Want to see the full answer?
Check out a sample textbook solution
Students have asked these similar questions
A random variable X takes values 0 and 1 with probabilities q and p, respectively, with q+p=1. find the moment generating function of X and show that all the moments about the origin equal p. (Note- Please include as much detailed solution/steps in the solution to understand, Thank you!)
1 (Expected Shortfall)
Suppose the price of an asset Pt follows a normal random walk, i.e., Pt =
Po+r₁ + ... + rt with r₁, r2,... being IID N(μ, o²).
Po+r1+.
⚫ Suppose the VaR of rt is VaRq(rt) at level q, find the VaR of the price
in T days, i.e., VaRq(Pt – Pt–T).
-
• If ESq(rt) = A, find ES₁(Pt – Pt–T).
2 (Normal Distribution)
Let rt be a log return. Suppose that r₁, 2, ... are IID N(0.06, 0.47).
What is the distribution of rt (4) = rt + rt-1 + rt-2 + rt-3?
What is P(rt (4) < 2)?
What is the covariance between r2(2) = 1 + 12 and 13(2) = r² + 13?
• What is the conditional distribution of r₁(3) = rt + rt-1 + rt-2 given
rt-2 = 0.6?
Chapter 3 Solutions
Introduction to Statistics and Data Analysis
Ch. 3.1 - Each person in a nationally representative sample...Ch. 3.1 - The graphical display on the next page is similar...Ch. 3.1 - Prob. 3ECh. 3.1 - The National Confectioners Association asked 1006...Ch. 3.1 - College student attitudes about e-books were...Ch. 3.1 - Prob. 6ECh. 3.1 - Prob. 7ECh. 3.1 - Prob. 8ECh. 3.1 - Prob. 9ECh. 3.1 - The survey on student attitude toward e-books...
Ch. 3.1 - Prob. 11ECh. 3.1 - Prob. 12ECh. 3.1 - An article about college loans (New Rules Would...Ch. 3.1 - Prob. 14ECh. 3.2 - Prob. 15ECh. 3.2 - Prob. 16ECh. 3.2 - Prob. 17ECh. 3.2 - The article Economy Low, Generosity High (USA...Ch. 3.2 - Prob. 19ECh. 3.2 - A report from Texas Transportation Institute...Ch. 3.2 - The percentage of teens not in school or working...Ch. 3.3 - Prob. 22ECh. 3.3 - The accompanying data on annual maximum wind speed...Ch. 3.3 - The accompanying relative frequency table is based...Ch. 3.3 - Prob. 25ECh. 3.3 - Medicares new medical plans offer a wide range of...Ch. 3.3 - The following two relative frequency distributions...Ch. 3.3 - Prob. 28ECh. 3.3 - The report Trends in College Pricing 2012...Ch. 3.3 - An exam is given to students in an introductory...Ch. 3.3 - The accompanying frequency distribution summarizes...Ch. 3.3 - Example 3.19 used annual rainfall data for...Ch. 3.3 - Prob. 33ECh. 3.3 - Prob. 34ECh. 3.3 - Prob. 35ECh. 3.3 - Prob. 36ECh. 3.3 - Using the five class intervals 100 to 120, 120 to...Ch. 3.4 - Prob. 38ECh. 3.4 - Consumer Reports Health (consumerreports.org) gave...Ch. 3.4 - Prob. 40ECh. 3.4 - Prob. 41ECh. 3.4 - Prob. 42ECh. 3.4 - Prob. 43ECh. 3.4 - Prob. 44ECh. 3.4 - The accompanying time series plot of movie box...Ch. 3.5 - The accompanying comparative bar chart is similar...Ch. 3.5 - Prob. 47ECh. 3.5 - The figure at the top right of the next page is...Ch. 3.5 - The two graphical displays below are similar to...Ch. 3.5 - The following graphical display is similar to one...Ch. 3.5 - Explain why the following graphical display...Ch. 3 - Prob. 52CRCh. 3 - Prob. 53CRCh. 3 - Prob. 54CRCh. 3 - The Connecticut Agricultural Experiment Station...Ch. 3 - The stem-and-leaf display of Exercise 3.55 uses...Ch. 3 - Prob. 57CRCh. 3 - Prob. 58CRCh. 3 - Does the size of a transplanted organ matter? A...Ch. 3 - Prob. 60CRCh. 3 - Prob. 61CRCh. 3 - Prob. 62CRCh. 3 - The article Tobacco and Alcohol Use in G-Rated...Ch. 3 - Prob. 64CRCh. 3 - Prob. 65CRCh. 3 - Prob. 66CRCh. 3 - Prob. 67CRCh. 3 - Prob. 68CRCh. 3 - Prob. 69CRCh. 3 - Many nutritional experts have expressed concern...Ch. 3 - Americium 241 (241Am) is a radioactive material...Ch. 3 - Does eating broccoli reduce the risk of prostate...Ch. 3 - An article that appeared in USA TODAY (August 11,...Ch. 3 - Sometimes samples are composed entirely of...Ch. 3 - Prob. 4CRECh. 3 - More than half of Californias doctors say they are...Ch. 3 - Based on observing more than 400 drivers in the...Ch. 3 - An article from the Associated Press (May 14,...Ch. 3 - Prob. 8CRECh. 3 - Prob. 9CRECh. 3 - Prob. 10CRECh. 3 - The article Determination of Most Representative...Ch. 3 - The paper Lessons from Pacemaker Implantations...Ch. 3 - How does the speed of a runner vary over the...Ch. 3 - Prob. 14CRECh. 3 - One factor in the development of tennis elbow, a...Ch. 3 - An article that appeared in USA TODAY (September...
Additional Math Textbook Solutions
Find more solutions based on key concepts
Provide an example of a qualitative variable and an example of a quantitative variable.
Elementary Statistics ( 3rd International Edition ) Isbn:9781260092561
(a) Make a stem-and-leaf plot for these 24 observations on the number of customers who used a down-town CitiBan...
APPLIED STAT.IN BUS.+ECONOMICS
Find E(X) for each of the distributions given in Exercise 2.1-3.
Probability And Statistical Inference (10th Edition)
Find all solutions of each equation in the interval .
Precalculus: A Unit Circle Approach (3rd Edition)
The largest polynomial that divides evenly into a list of polynomials is called the _______.
Elementary & Intermediate Algebra
NOTE: Write your answers using interval notation when appropriate.
CHECKING ANALYTIC SKILLS Fill in each blank ...
Graphical Approach To College Algebra
Knowledge Booster


Learn more about
Need a deep-dive on the concept behind this application? Look no further. Learn more about this topic, statistics and related others by exploring similar questions and additional content below.Similar questions
- 3 (Sharpe-ratio) Suppose that X1, X2,..., is a lognormal geometric random walk with parameters (μ, o²). Specifically, suppose that X = Xo exp(rı + ...Tk), where Xo is a fixed constant and r1, T2, ... are IID N(μ, o²). Find the Sharpe-ratios of rk and log(Xk) — log(Xo) respectively, assuming the risk free return is 0.arrow_forwardi need help with question 2arrow_forward4 (Value-at-Risk and Expected Shortfall) Suppose X Find VaR0.02(X) and ES0.02 (X). ~ Uniform(-1, 1).arrow_forward
- 亚 ח Variables Name avgdr employ educ exerany Label AVG ALCOHOLIC DRINKS PER DAY IN PAST 30 EMPLOYMENT STATUS EDUCATION LEVEL EXERCISE IN PAST 30 DAYSarrow_forwardVariables Name wage hours IQ KWW educ exper tenure age married black south urban sibs brthord meduc feduc Label monthly earnings average weekly hours IQ score knowledge of world work score years of education years of work experience years with current employer age in years =1 if married =1 if black =1 if live in south =1 if live in SMSA number of siblings birth order mother's education father's educationarrow_forwardInformation for questions 4 • • Please Download "wages" from Canvas (the link to this dataset is right below the HWA1 questions - it is a Microsoft excel worksheet) and store it in your favorite folder. It contains 797 observations and 16 variables. The "state" variable gives the names of the states involved in this dataset. • You need to have excel on your computer to open this dataset. i. You should use File > Import > Excel Spreadsheet etc. as done in class 3 convert this file into a Stata dataset. Once you are done, write the final STATA code that makes the transformation of an excel file to a STATA file possible. ii. Write a code that will close the log file that has been open since Question 1 part ii.arrow_forward
- The mean, variance, skewness and kurtosis of a dataset are given as - Mean = 15, Variance = 20, SKewness = 1.5 and Kurtosis = 3.5 calculate the first four raw moments. (Note- Please include as much detailed solution/steps in the solution to understand, Thank you!)arrow_forwardWrite codes to perform the functions in each of these cases i. ii. Apply cd command to tell STATA the filepath associated with your "favorite folder" (use the same name for the favorite folder that we have been using in class) Apply log using command to tell stata that you are creating a log file to record the codes and the outcomes of these codes. Make sure your log file is called loghwa1_W25.smcl. Do not forget to include the replace option. iii. Get help for the "regress" command & include a screenshot of the outcome of this code iv. V. Open a stata file stored in STATA memory called pop2000.dta Continue from question iv. Save this file in your favorite folder (current working directory) using a different name & a replace optionarrow_forwardAre there any unusually high or low pH levels in this sample of wells?arrow_forward
- 0 n AM RIES s of of 10 m Frequency 40 Frequency 20 20 30 10 You make two histograms from two different data sets (see the following figures), each one containing 200 observations. Which of the histograms has a smaller spread: the first or the second? 40 30 20 10 0 20 40 60 0 20 20 40 60 60 80 80 100 80 100arrow_forwardTIP the aren't, the data are not sym 11 Suppose that the average salary at a certain company is $100,000, and the median salary is $40,000. a. What do these figures tell you about the shape of the histogram of salaries at this company? b. Which measure of center is more appro- priate here? c. Suppose that the company goes through a salary negotiation. How can people on each side use these summary statistics to their advantage? 6360 be 52 PART 1 Getting Off to a Statistically Significant Sarrow_forward12 Suppose that you know that a data set is skewed left, and you know that the two measures of center are 19 and 38. Which figure is the mean and which is the median?arrow_forward
arrow_back_ios
SEE MORE QUESTIONS
arrow_forward_ios
Recommended textbooks for you
 Glencoe Algebra 1, Student Edition, 9780079039897...AlgebraISBN:9780079039897Author:CarterPublisher:McGraw Hill
 Big Ideas Math A Bridge To Success Algebra 1: Stu...AlgebraISBN:9781680331141Author:HOUGHTON MIFFLIN HARCOURTPublisher:Houghton Mifflin Harcourt
 Holt Mcdougal Larson Pre-algebra: Student Edition...AlgebraISBN:9780547587776Author:HOLT MCDOUGALPublisher:HOLT MCDOUGAL
 Trigonometry (MindTap Course List)TrigonometryISBN:9781305652224Author:Charles P. McKeague, Mark D. TurnerPublisher:Cengage Learning
Glencoe Algebra 1, Student Edition, 9780079039897...
Algebra
ISBN:9780079039897
Author:Carter
Publisher:McGraw Hill
Big Ideas Math A Bridge To Success Algebra 1: Stu...
Algebra
ISBN:9781680331141
Author:HOUGHTON MIFFLIN HARCOURT
Publisher:Houghton Mifflin Harcourt
Holt Mcdougal Larson Pre-algebra: Student Edition...
Algebra
ISBN:9780547587776
Author:HOLT MCDOUGAL
Publisher:HOLT MCDOUGAL
Trigonometry (MindTap Course List)
Trigonometry
ISBN:9781305652224
Author:Charles P. McKeague, Mark D. Turner
Publisher:Cengage Learning
Time Series Analysis Theory & Uni-variate Forecasting Techniques; Author: Analytics University;https://www.youtube.com/watch?v=_X5q9FYLGxM;License: Standard YouTube License, CC-BY
Operations management 101: Time-series, forecasting introduction; Author: Brandoz Foltz;https://www.youtube.com/watch?v=EaqZP36ool8;License: Standard YouTube License, CC-BY