
Concept explainers
Videos
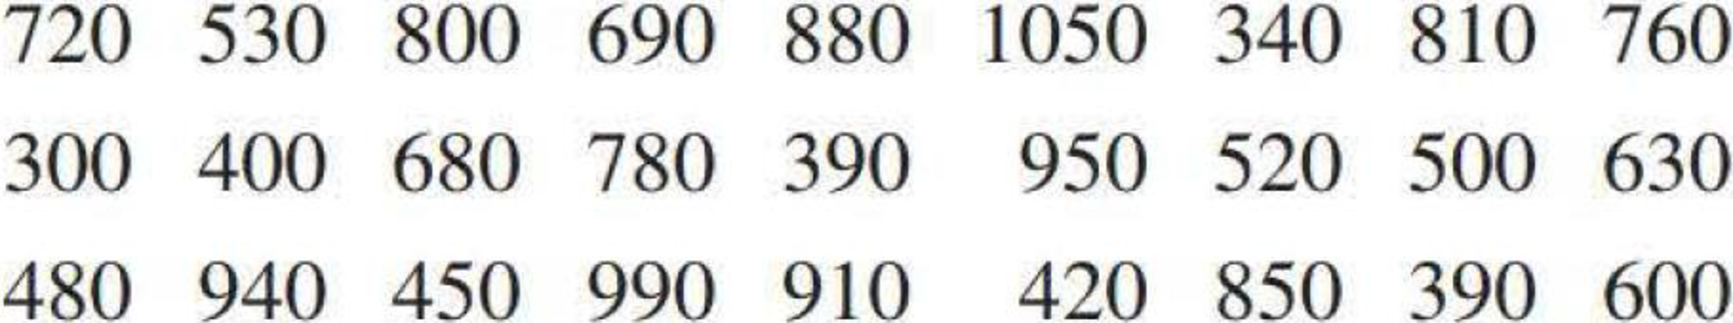
Many nutritional experts have expressed concern about the high levels of sodium in prepared foods. The following data on sodium content (in milligrams) per frozen meal appeared in the article “Comparison of ‘Light’ Frozen Meals” (Boston Globe, April 24, 1991):
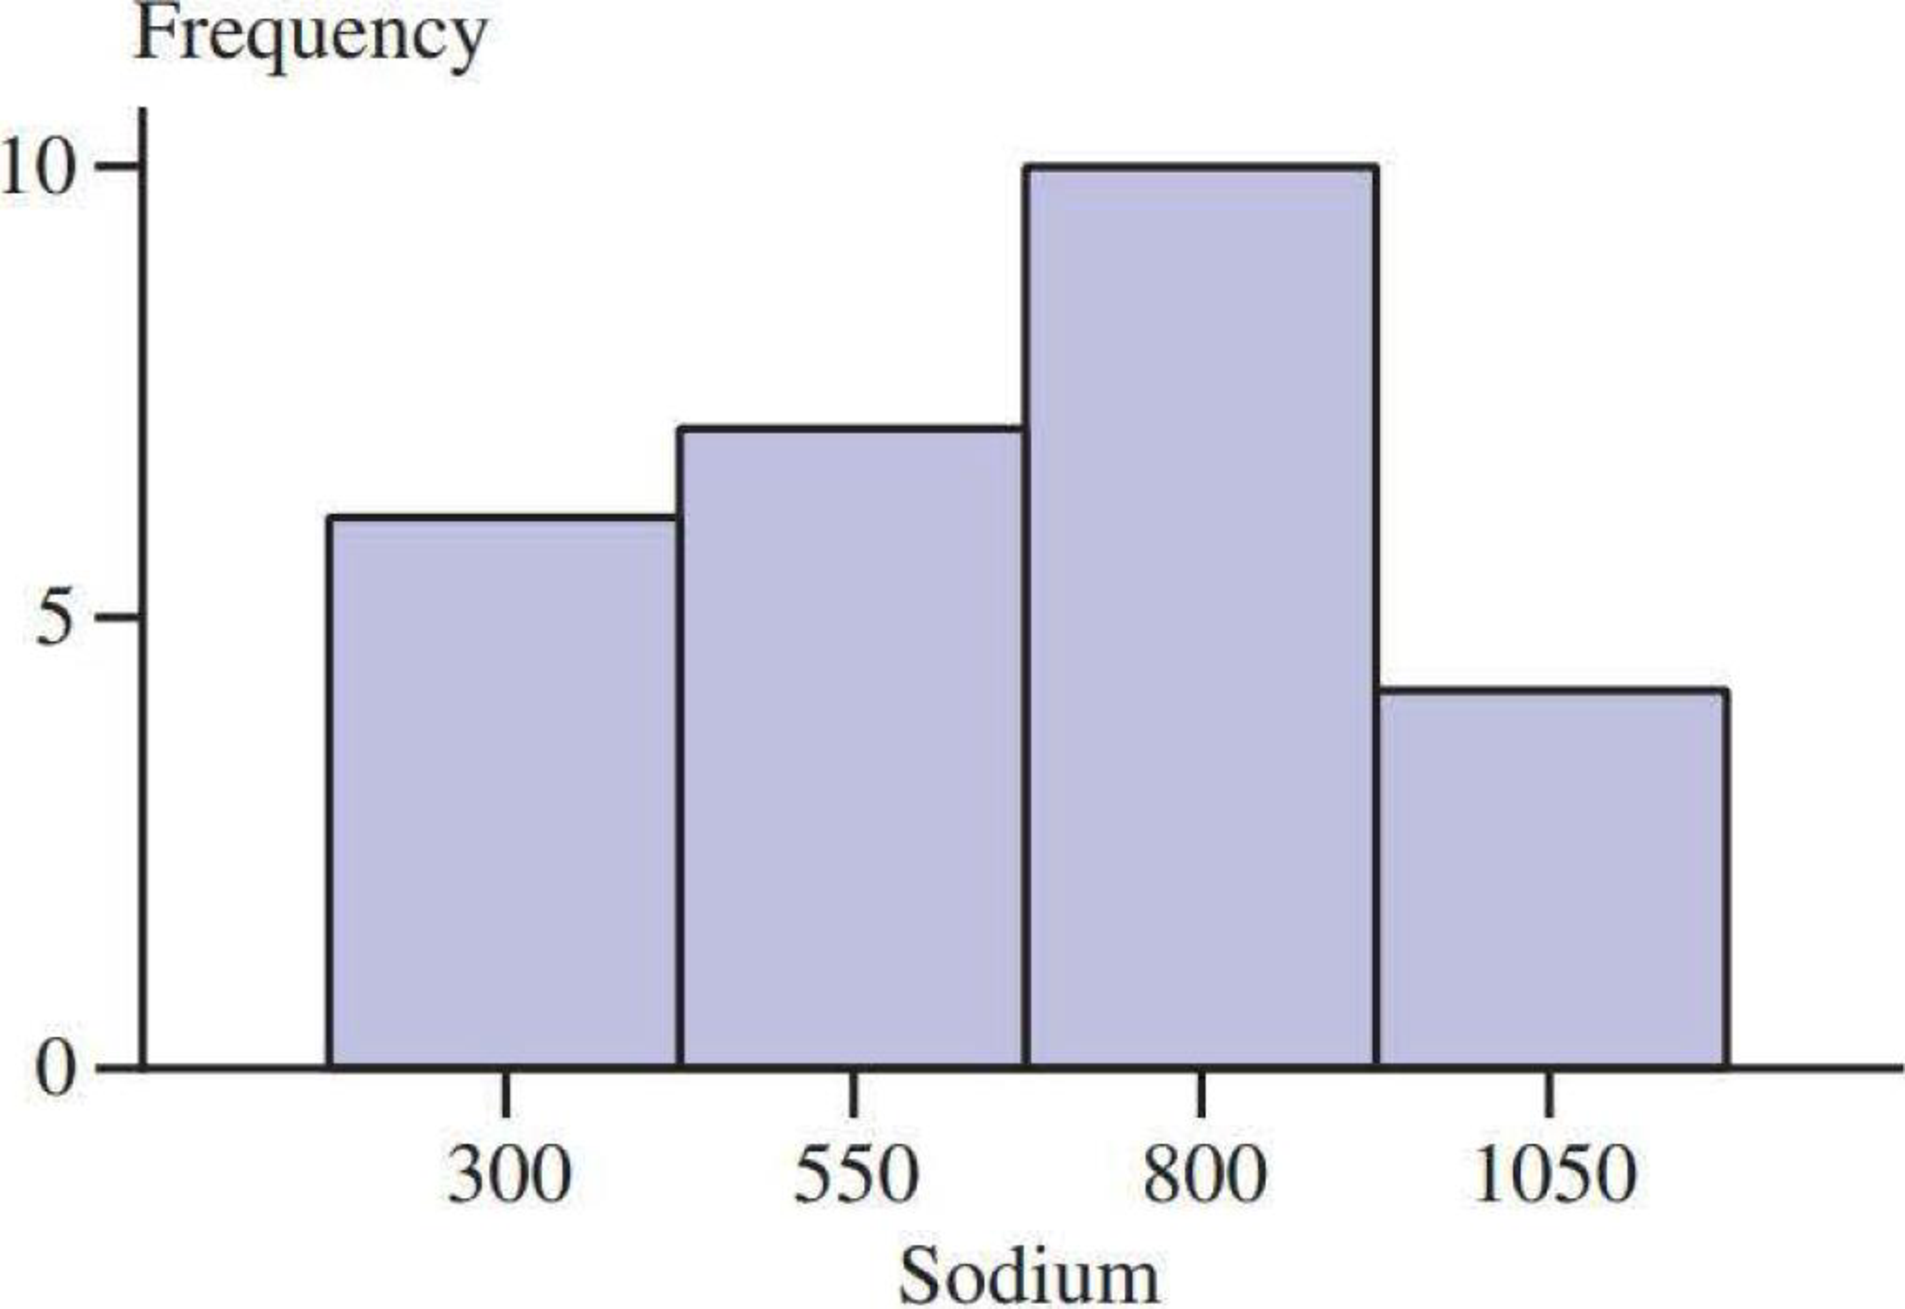
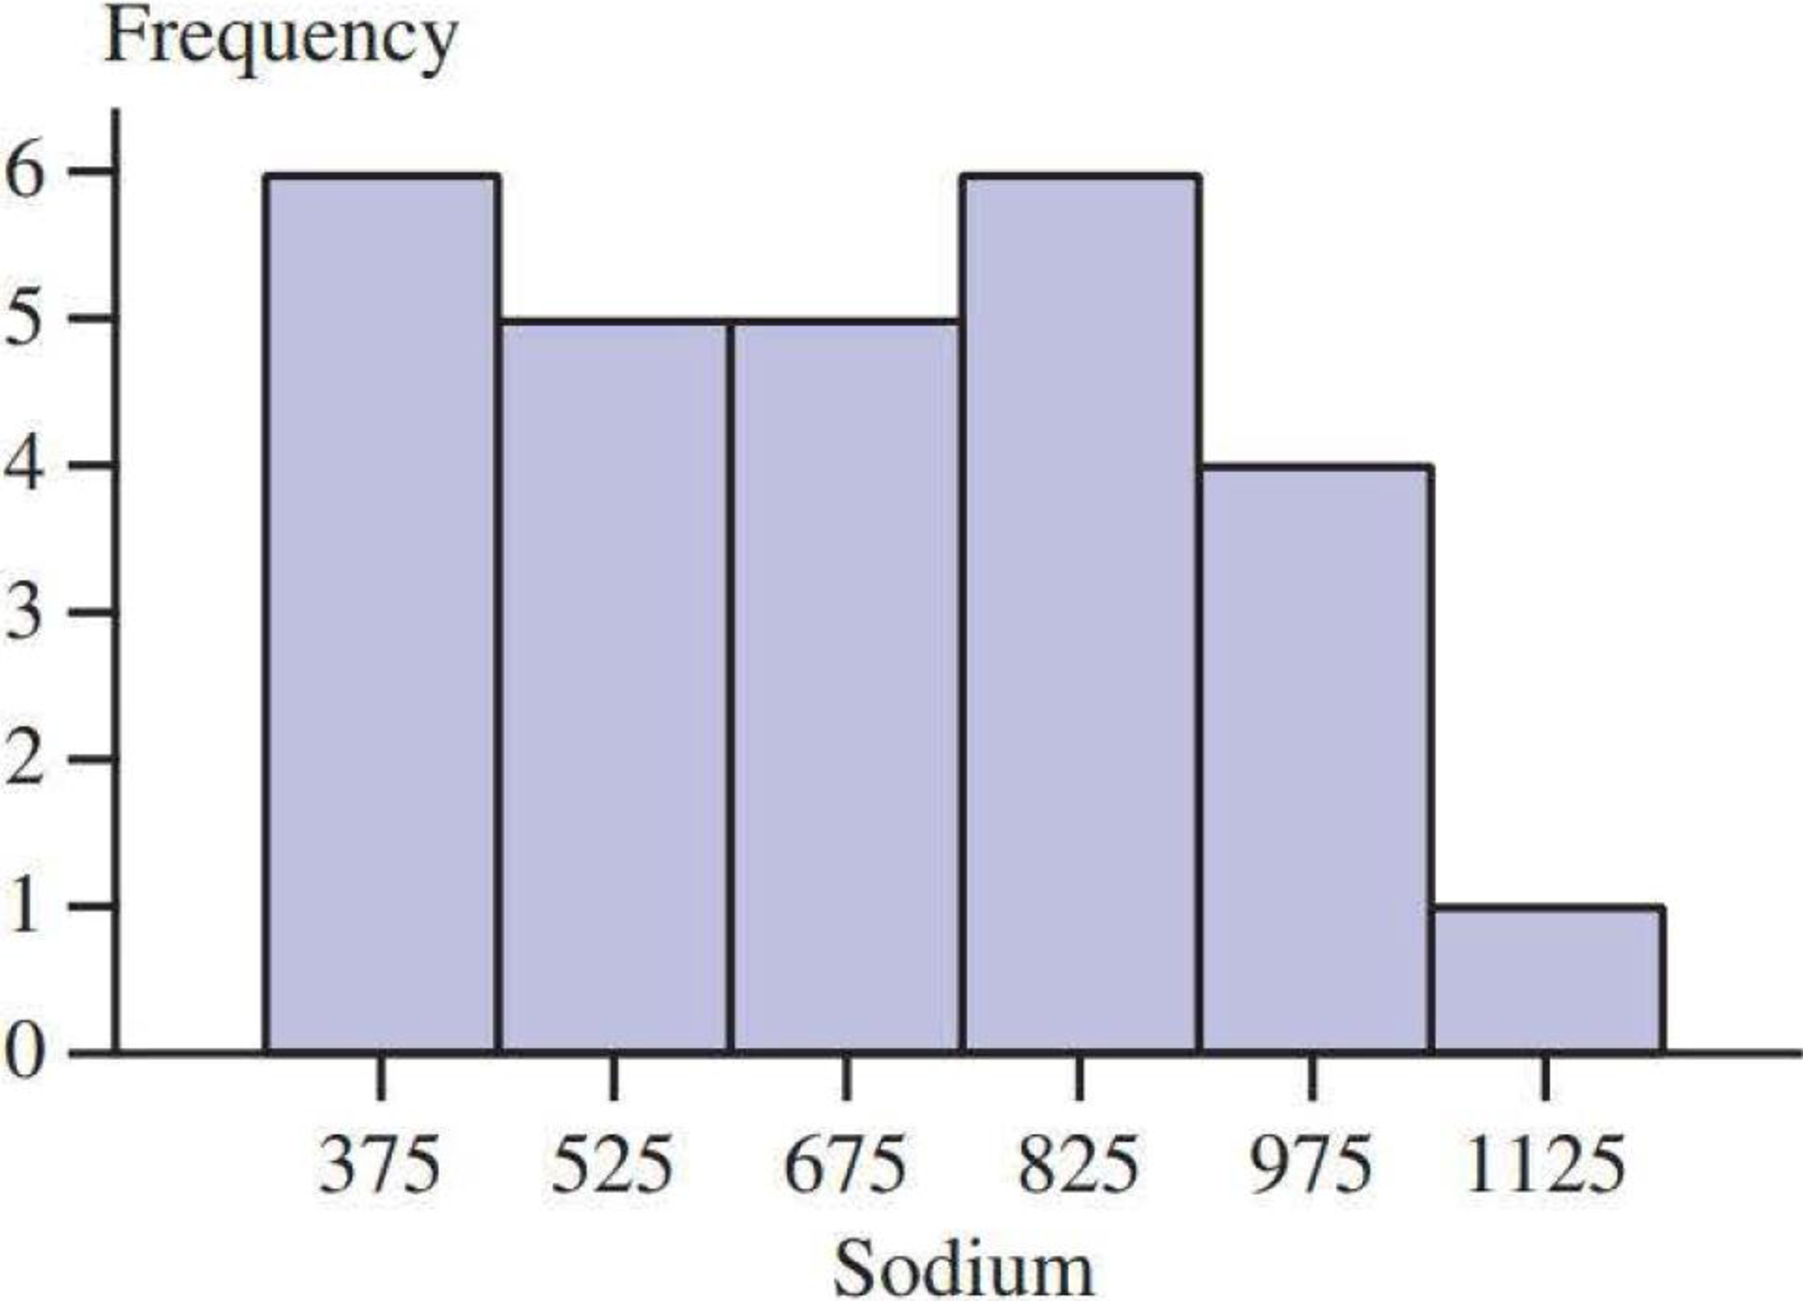
Two histograms for these data are shown below and on the next page.
- a. Do the two histograms give different impressions about the distribution of values?
- b. Use each histogram to determine the approximate proportion of observations that are less than 800, and compare to the actual proportion.
a.
Check whether the interpretations of two histograms are different.
Answer to Problem 70CR
Yes, the two histograms give different impressions about the data of sodium content.
Explanation of Solution
The data represents the sodium content per frozen meal.
Skewness:
In statistics, skewness is a measure by which anyone can measure the asymmetrical behavior of a distribution.
A distribution is said to be symmetric, when its mean, median, and mode are the same. In other words it can be said that, the length of the curve of the left-hand tail will be a mirror image of the right-hand tail.
Therefore, the shape of a distribution can be identified by using the measure of skewness.
Left-skewed:
For a left-skewed distribution,
Right-skewed:
For a right-skewed distribution,
Since, the length of the curve of left-hand tail is greater than the right-hand tail, the first histogram indicates that, the distribution of sodium content is negatively skewed.
Since, the length of the curve of right-hand tail is greater than the left-hand tail, the second histogram indicates that, the distribution of sodium content is positively skewed.
Thus, the two histograms give different impressions about the data of sodium content.
b.
Find the proportion of observations that are less than 800 from the first histogram.
Compute the proportion of observations that are less than 800 from the second histogram.
Answer to Problem 70CR
The proportion of observations that are less than 800 from the first histogram is 0.6667.
The proportion of observations that are less than 800 from the second histogram is 0.6667.
Explanation of Solution
The general formula for the relative frequency or proportion is,
First histogram:
From the first histogram display, it can be seen that the frequency of the sodium content that is less than 800 is
The proportion of sodium content that is less than 800 is obtained as:
Substituting the values of sodium content that is less than “18” as the frequency and total frequency as “27”,
Thus, nearly 66.67% of sodium content is less than 800.
Second histogram:
The Objective is to find the frequency of sodium content that is less than 800.
The class width of class intervals is 150. The fourth interval is between 750 and 900.
The approximate range of less than 800 is 1/3rd part of the class interval 750 and 900.
Hence, the frequency of the sodium content that is less than 800 is
The proportion of sodium content that is less than 800 is obtained as:
Substituting the values of sodium content that is less than “18” as the frequency and total frequency as “27”,
Thus, nearly 66.67% of sodium content is less than 800.
Want to see more full solutions like this?
Chapter 3 Solutions
Introduction to Statistics and Data Analysis
Additional Math Textbook Solutions
Precalculus: A Unit Circle Approach (3rd Edition)
APPLIED STAT.IN BUS.+ECONOMICS
University Calculus: Early Transcendentals (4th Edition)
Introductory Statistics
A Problem Solving Approach To Mathematics For Elementary School Teachers (13th Edition)


- A survey of 581 citizens found that 313 of them favor a new bill introduced by the city. We want to find a 95% confidence interval for the true proportion of the population who favor the bill. What is the lower limit of the interval? Enter the result as a decimal rounded to 3 decimal digits. Your Answer:arrow_forwardLet X be a continuous RV with PDF where a > 0 and 0 > 0 are parameters. verify that f-∞ /x (x)dx = 1. Find the CDF, Fx (7), of X.arrow_forward6. [20] Let X be a continuous RV with PDF 2(1), 1≤x≤2 fx(x) = 0, otherwisearrow_forward
- A survey of 581 citizens found that 313 of them favor a new bill introduced by the city. We want to find a 95% confidence interval for the true proportion of the population who favor the bill. What is the lower limit of the interval? Enter the result as a decimal rounded to 3 decimal digits. Your Answer:arrow_forwardA survey of 581 citizens found that 313 of them favor a new bill introduced by the city. We want to find a 95% confidence interval for the true proportion of the population who favor the bill. What is the lower limit of the interval? Enter the result as a decimal rounded to 3 decimal digits. Your Answer:arrow_forward2. The SMSA data consisting of 141 observations on 10 variables is fitted by the model below: 1 y = Bo+B1x4 + ẞ2x6 + ẞ3x8 + √1X4X8 + V2X6X8 + €. See Question 2, Tutorial 3 for the meaning of the variables in the above model. The following results are obtained: Estimate Std. Error t value Pr(>|t|) (Intercept) 1.302e+03 4.320e+02 3.015 0.00307 x4 x6 x8 x4:x8 x6:x8 -1.442e+02 2.056e+01 -7.013 1.02e-10 6.340e-01 6.099e+00 0.104 0.91737 -9.455e-02 5.802e-02 -1.630 0.10550 2.882e-02 2.589e-03 11.132 1.673e-03 7.215e-04 2.319 F) x4 1 3486722 3486722 17.9286 4.214e-05 x6 1 14595537 x8 x4:x8 x6:x8 1 132.4836 < 2.2e-16 1045693 194478 5.3769 0.02191 1 1198603043 1198603043 6163.1900 < 2.2e-16 1 25765100 25765100 1045693 Residuals 135 26254490 Estimated variance matrix (Intercept) x4 x6 x8 x4:x8 x6:x8 (Intercept) x4 x6 x8 x4:x8 x6:x8 0.18875694 1.866030e+05 -5.931735e+03 -2.322825e+03 -16.25142055 0.57188953 -5.931735e+03 4.228816e+02 3.160915e+01 0.61621781 -0.03608028 -0.00445013 -2.322825e+03…arrow_forward
- In some applications the distribution of a discrete RV, X resembles the Poisson distribution except that 0 is not a possible value of X. Consider such a RV with PMF where 1 > 0 is a parameter, and c is a constant. (a) Find the expression of c in terms of 1. (b) Find E(X). (Hint: You can use the fact that, if Y ~ Poisson(1), the E(Y) = 1.)arrow_forwardSuppose that X ~Bin(n,p). Show that E[(1 - p)] = (1-p²)".arrow_forwardI need help with this problem and an explanation of the solution for the image described below. (Statistics: Engineering Probabilities)arrow_forward
- I need help with this problem and an explanation of the solution for the image described below. (Statistics: Engineering Probabilities)arrow_forwardThis exercise is based on the following data on four bodybuilding supplements. (Figures shown correspond to a single serving.) Creatine(grams) L-Glutamine(grams) BCAAs(grams) Cost($) Xtend(SciVation) 0 2.5 7 1.00 Gainz(MP Hardcore) 2 3 6 1.10 Strongevity(Bill Phillips) 2.5 1 0 1.20 Muscle Physique(EAS) 2 2 0 1.00 Your personal trainer suggests that you supplement with at least 10 grams of creatine, 39 grams of L-glutamine, and 90 grams of BCAAs each week. You are thinking of combining Xtend and Gainz to provide you with the required nutrients. How many servings of each should you combine to obtain a week's supply that meets your trainer's specifications at the least cost? (If an answer does not exist, enter DNE.) servings of xtend servings of gainzarrow_forwardI need help with this problem and an explanation of the solution for the image described below. (Statistics: Engineering Probabilities)arrow_forward
 Glencoe Algebra 1, Student Edition, 9780079039897...AlgebraISBN:9780079039897Author:CarterPublisher:McGraw Hill
 Big Ideas Math A Bridge To Success Algebra 1: Stu...AlgebraISBN:9781680331141Author:HOUGHTON MIFFLIN HARCOURTPublisher:Houghton Mifflin Harcourt
 Holt Mcdougal Larson Pre-algebra: Student Edition...AlgebraISBN:9780547587776Author:HOLT MCDOUGALPublisher:HOLT MCDOUGAL
 Functions and Change: A Modeling Approach to Coll...AlgebraISBN:9781337111348Author:Bruce Crauder, Benny Evans, Alan NoellPublisher:Cengage Learning